Role: Individual contributor/DRI
Keywords: User experience, User research, UI design, Observability & monitoring
Context
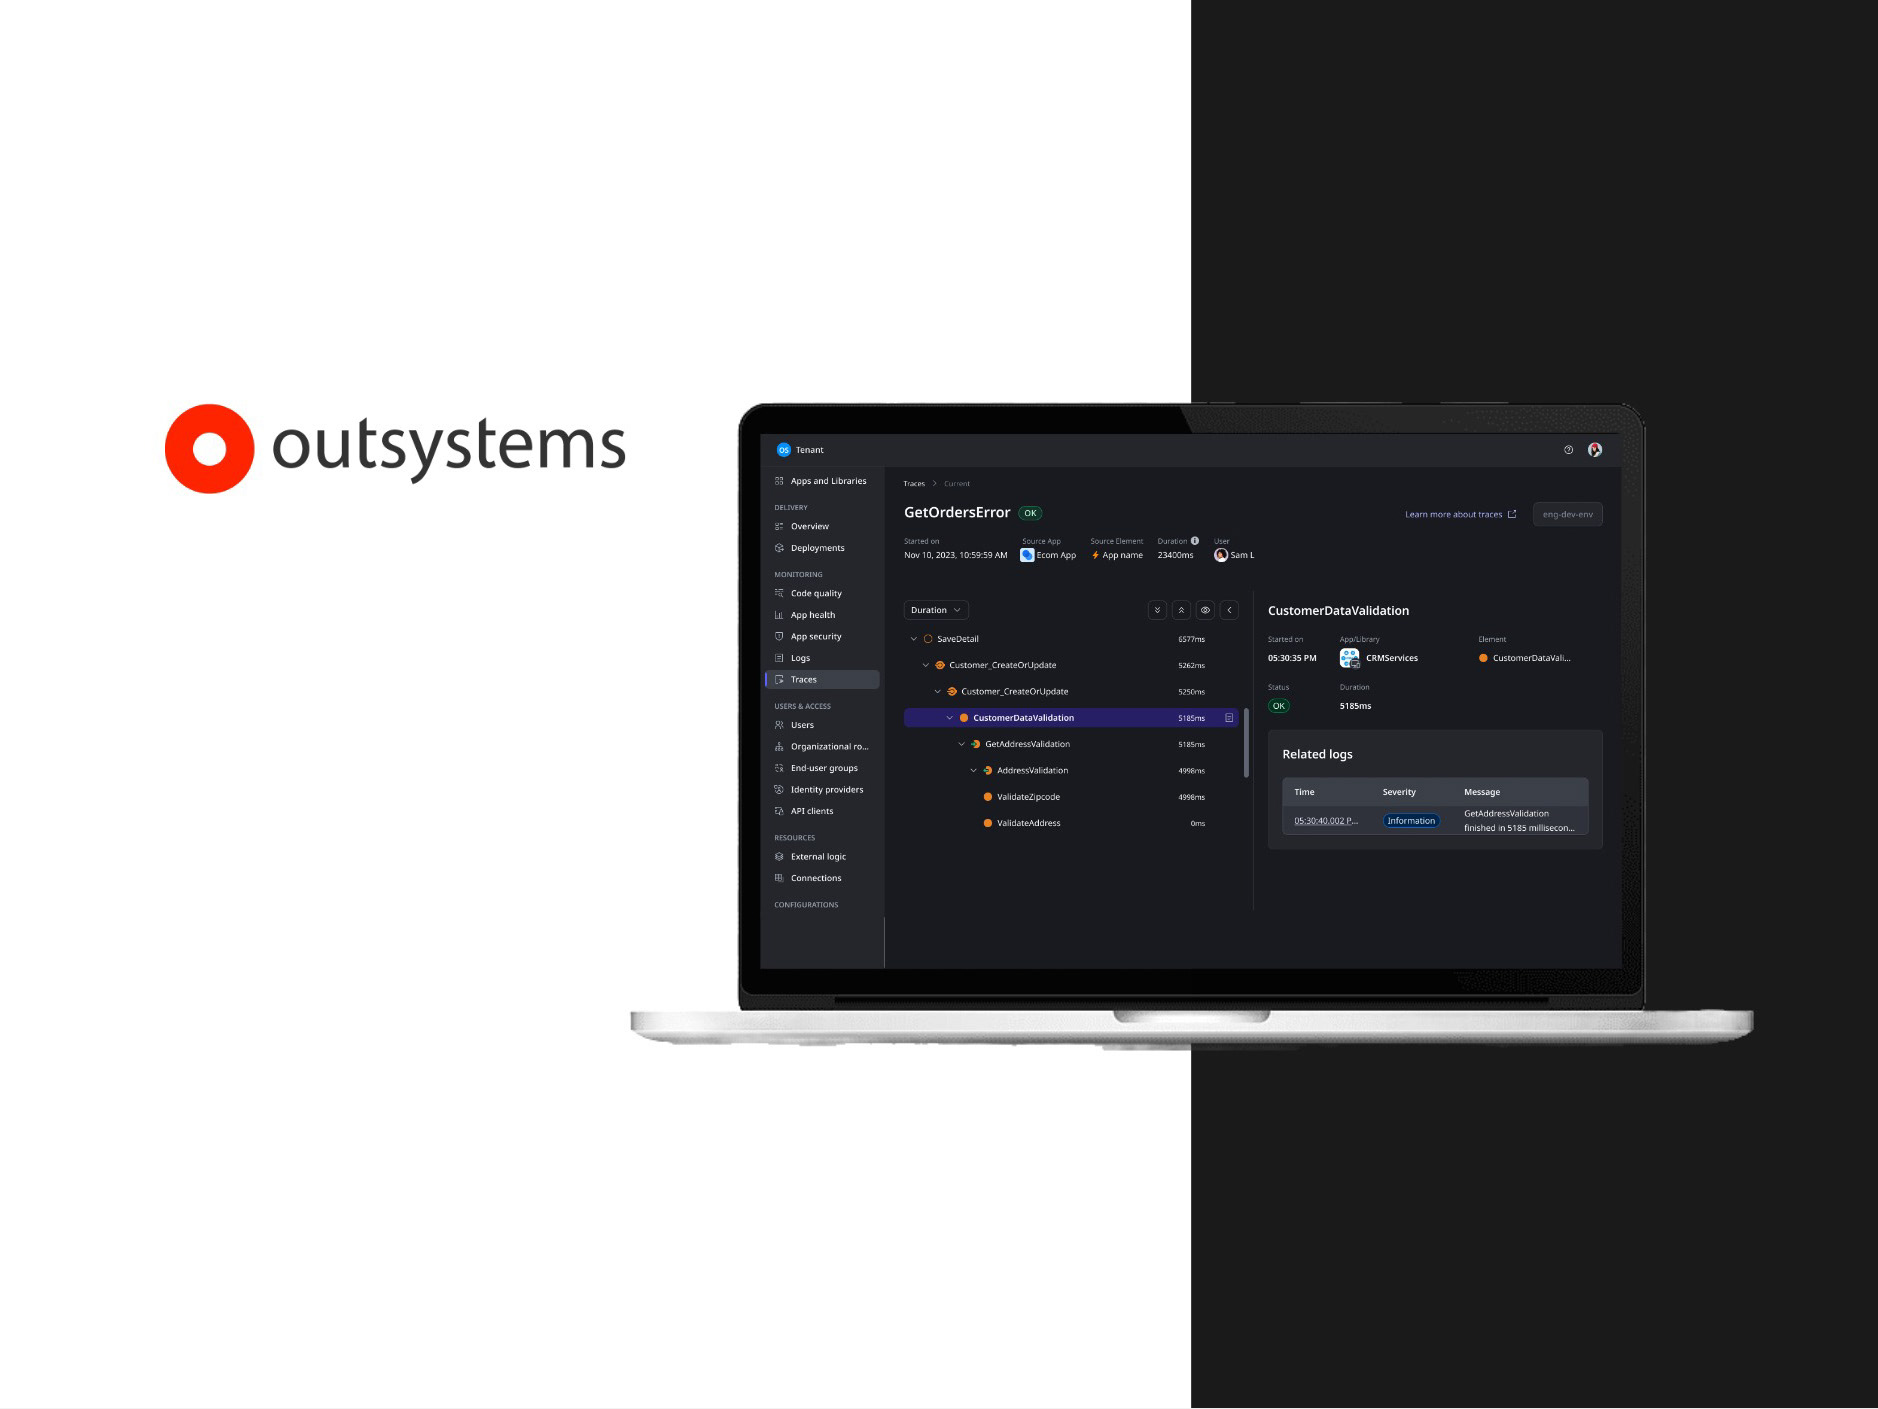
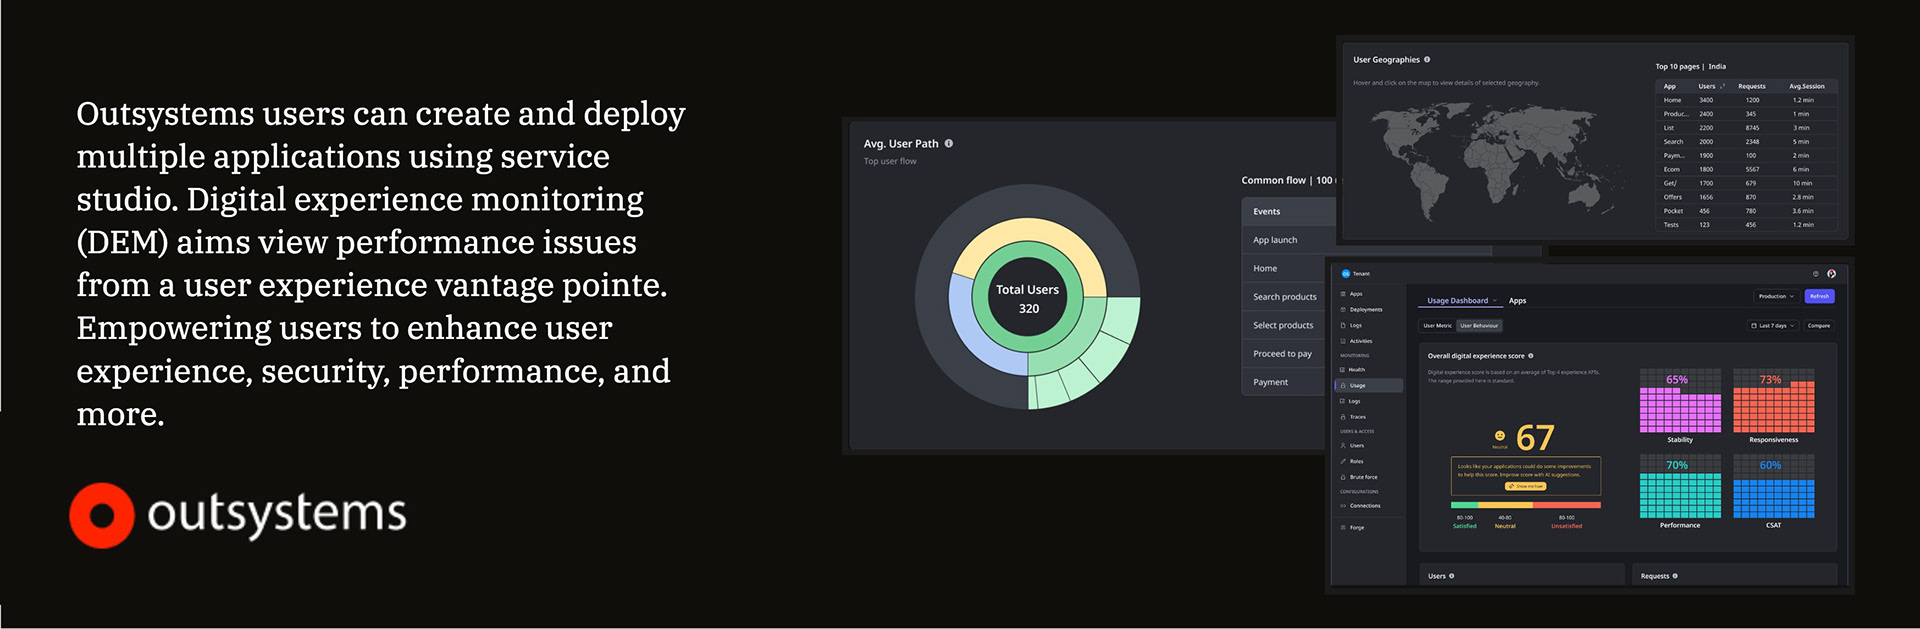
Outsystems is a low code platform that also offers ways to track & manage lifecycle of an application through their web portal; ODC (Outsystems developer cloud). Outsystems users are enabled to manage entire application lifecycle; right from an application's inception till it is in production and being used by real users. The add on capability, Digital monitoring experience (Internally called 'App usage') is aimed to let product teams be more informed about how their users use their applications. Which in turn would help identifying in any technical & user experience issues.
High level need & goal
Many Outsystems customers already have APM (Application performance monitoring) tools of their own, but they have their own shortcomings.
• Other APM tools tend to be complex & pricey
• Applications are created in Outsystems IDE, it becomes difficult for customers to go back and forth from different monitoring tools to Outsystems
A major factor in introducing this capability was to keep everything in Outsystems eco system and help developers. DEM was listed as the top priorities based on an extensive market research in features that our potential customers would want and lead to 'X' number of conversions.
Based on this business objective, we started with a simple problem definition which would evolve later as more research was brought in picture.
''Provide access to the most relevant digital experience monitoring information in a way that digesting this data is easy, frictionless, and informative for any user profile.''
Design process
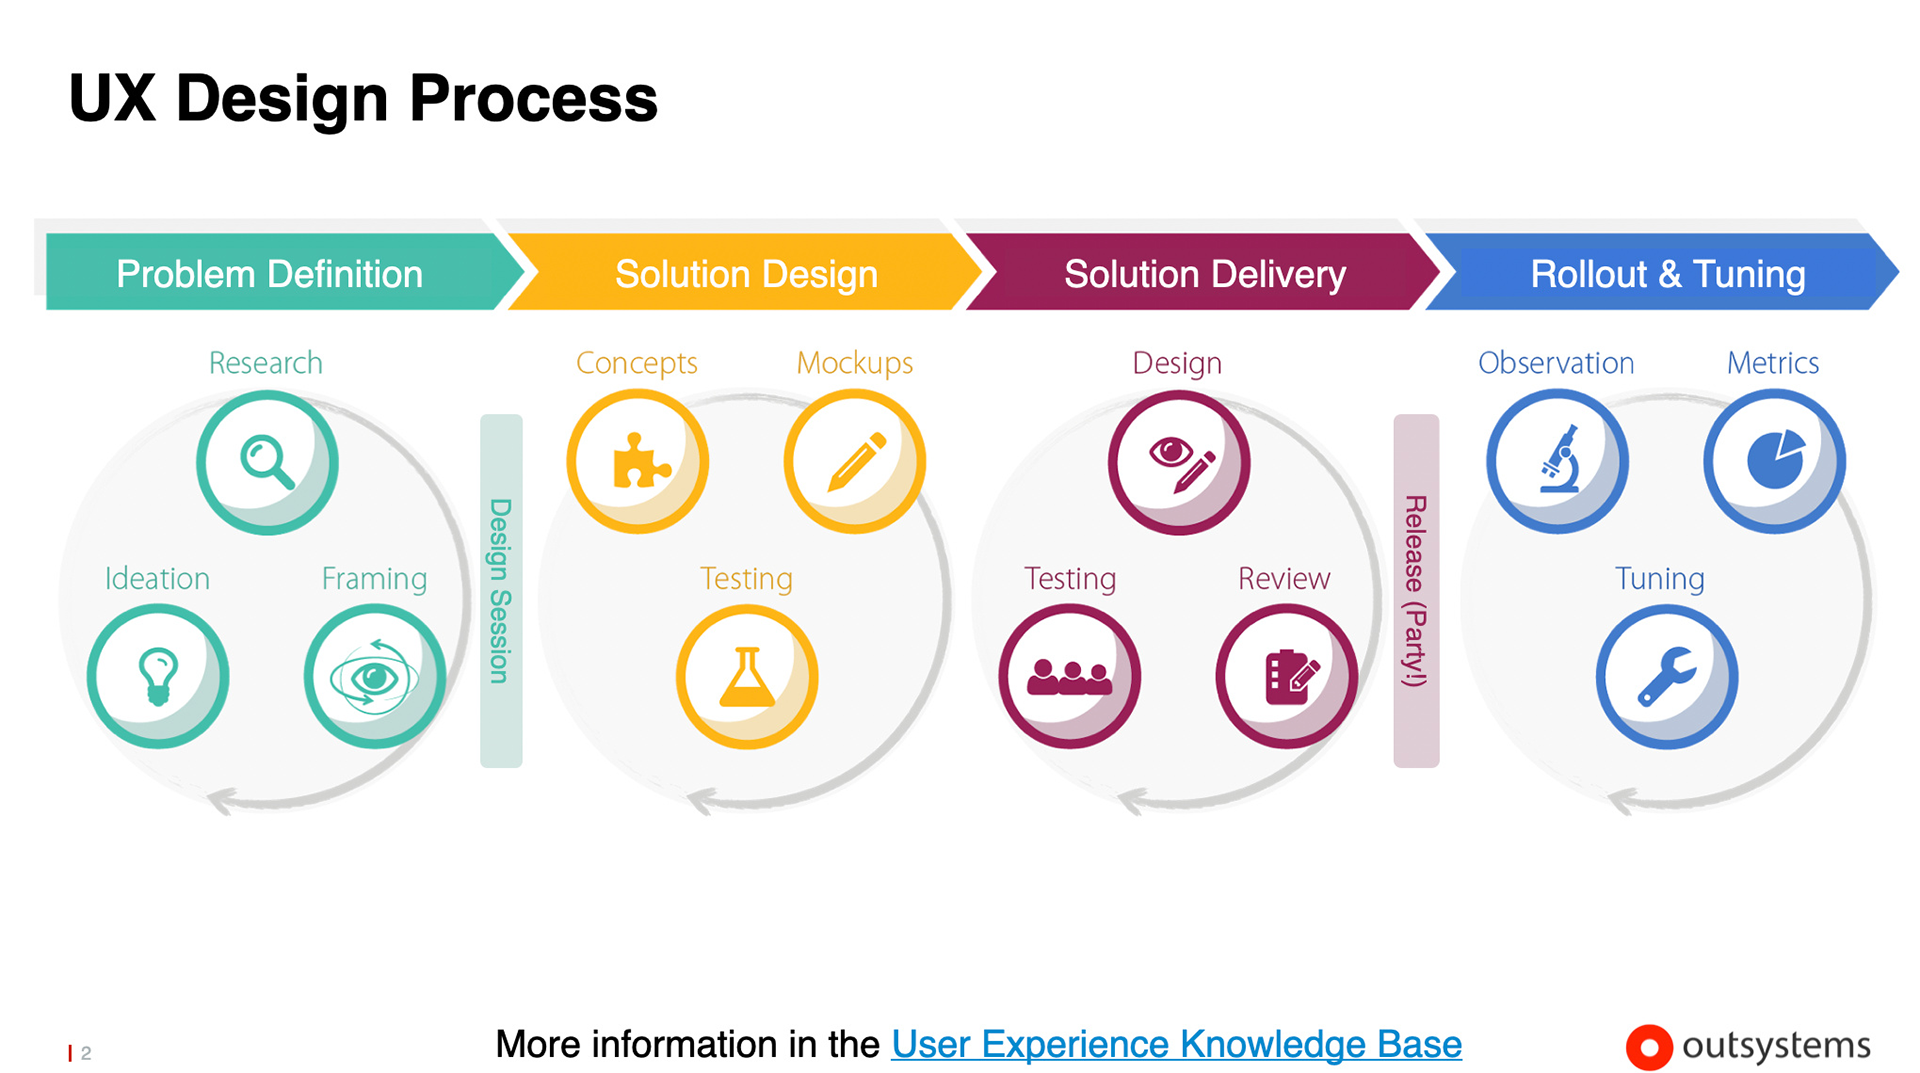
Outsystems UX group uses IDEO design methodologies with multiple assets available to the designer. Based on the project complexity and timelines, the DRI choose appropriate methods and assets.

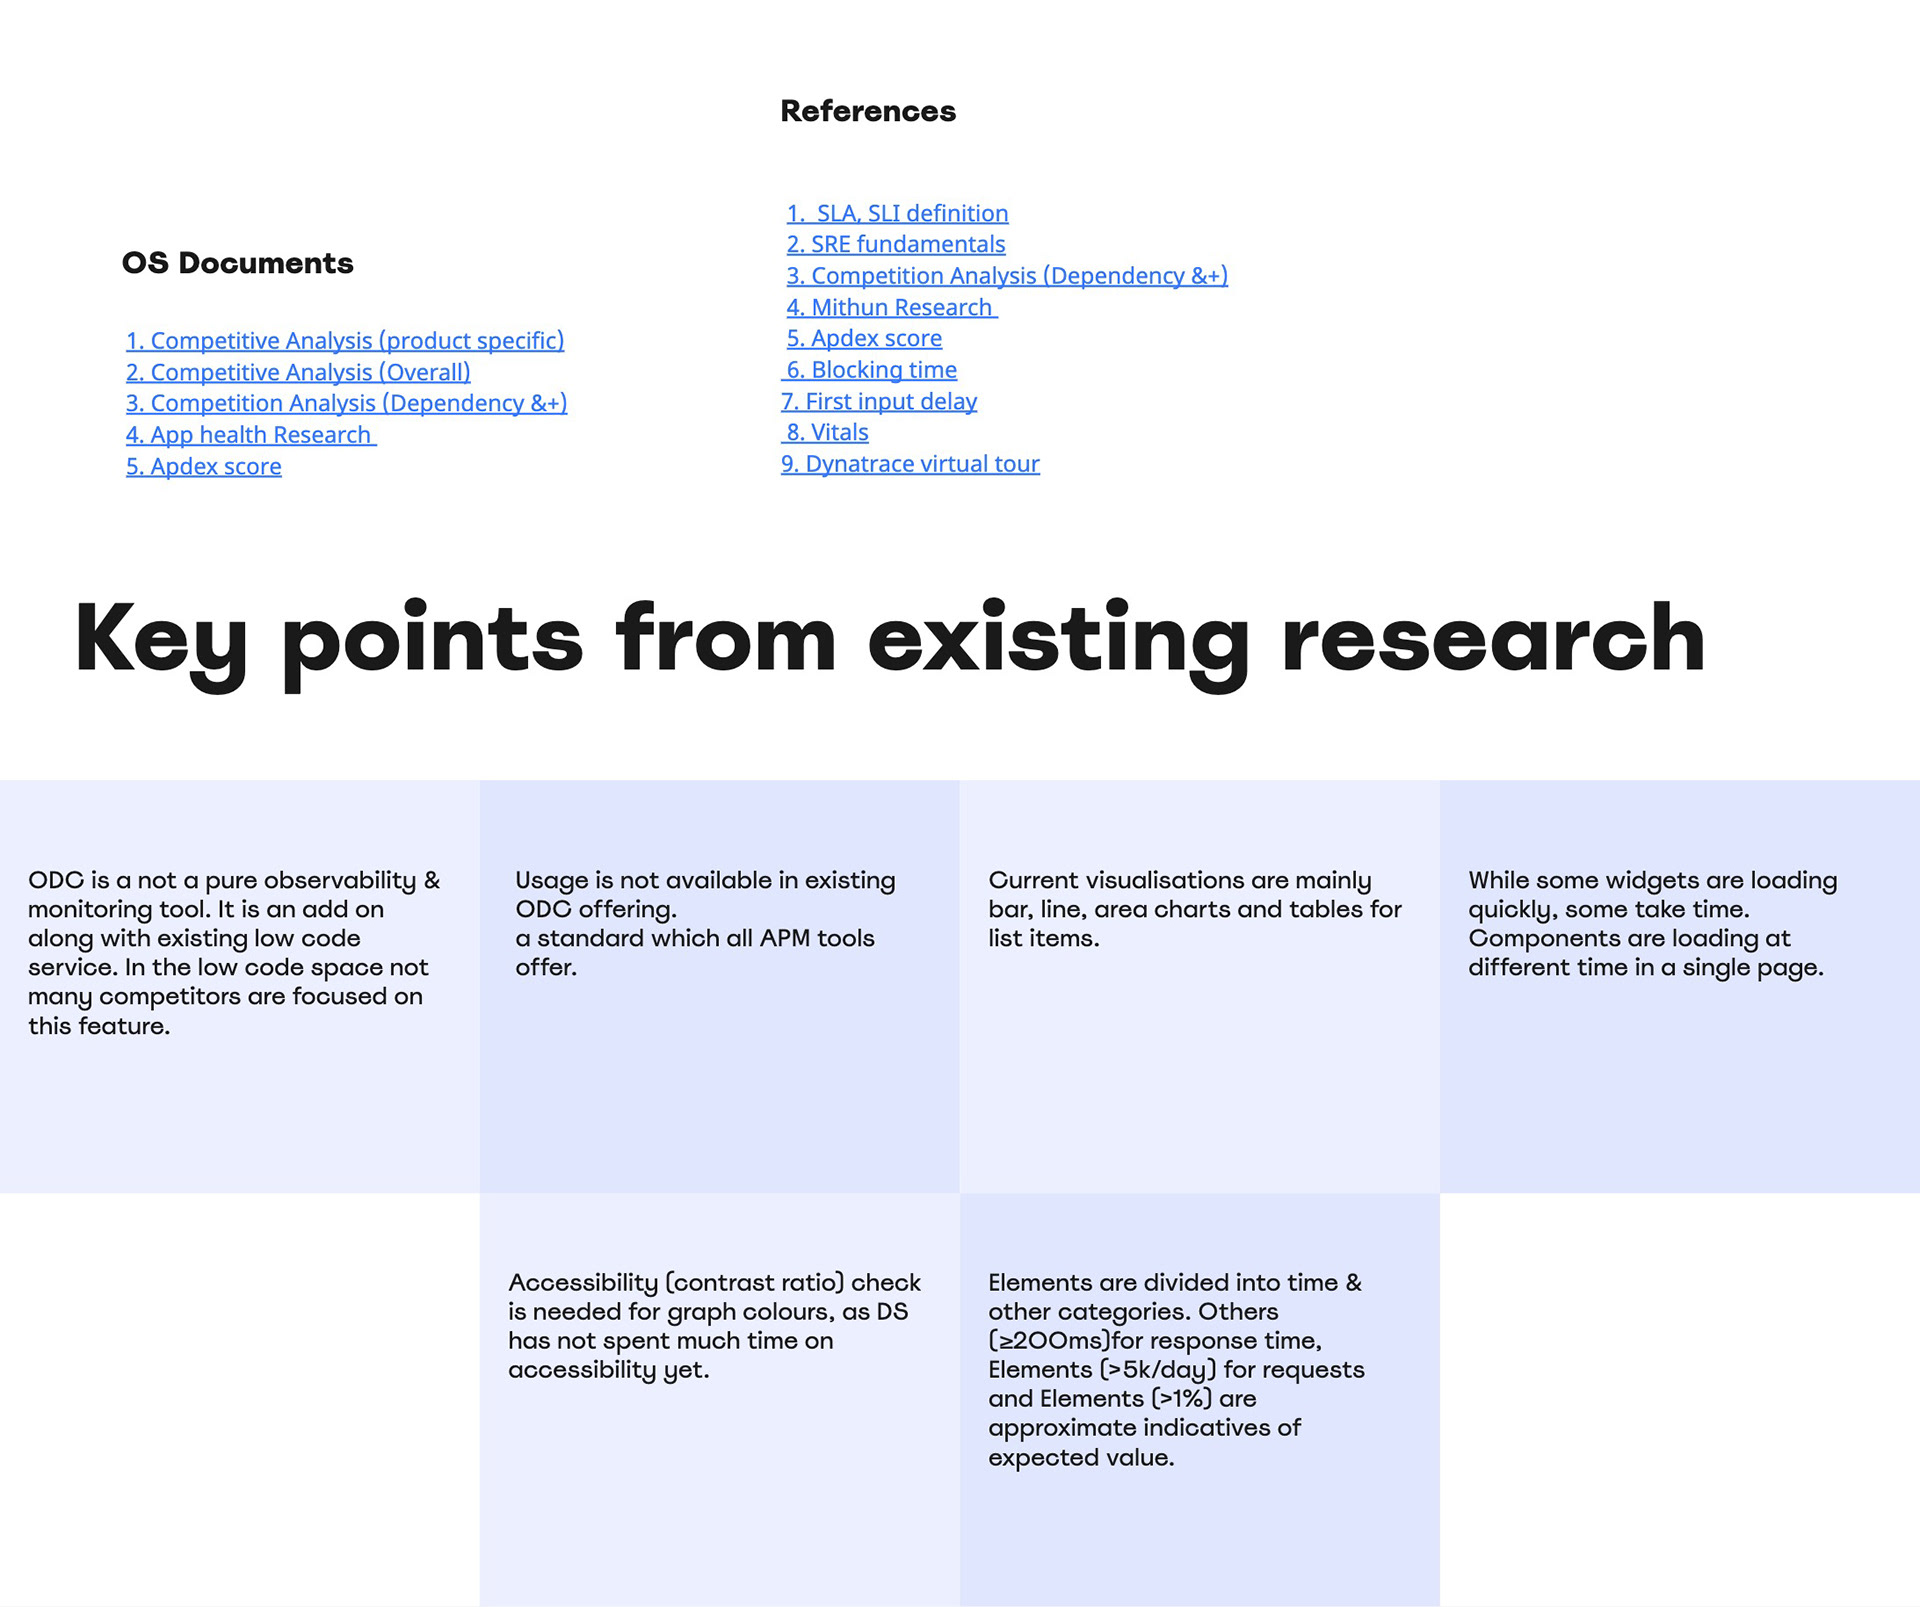
Problem definition | Desk research
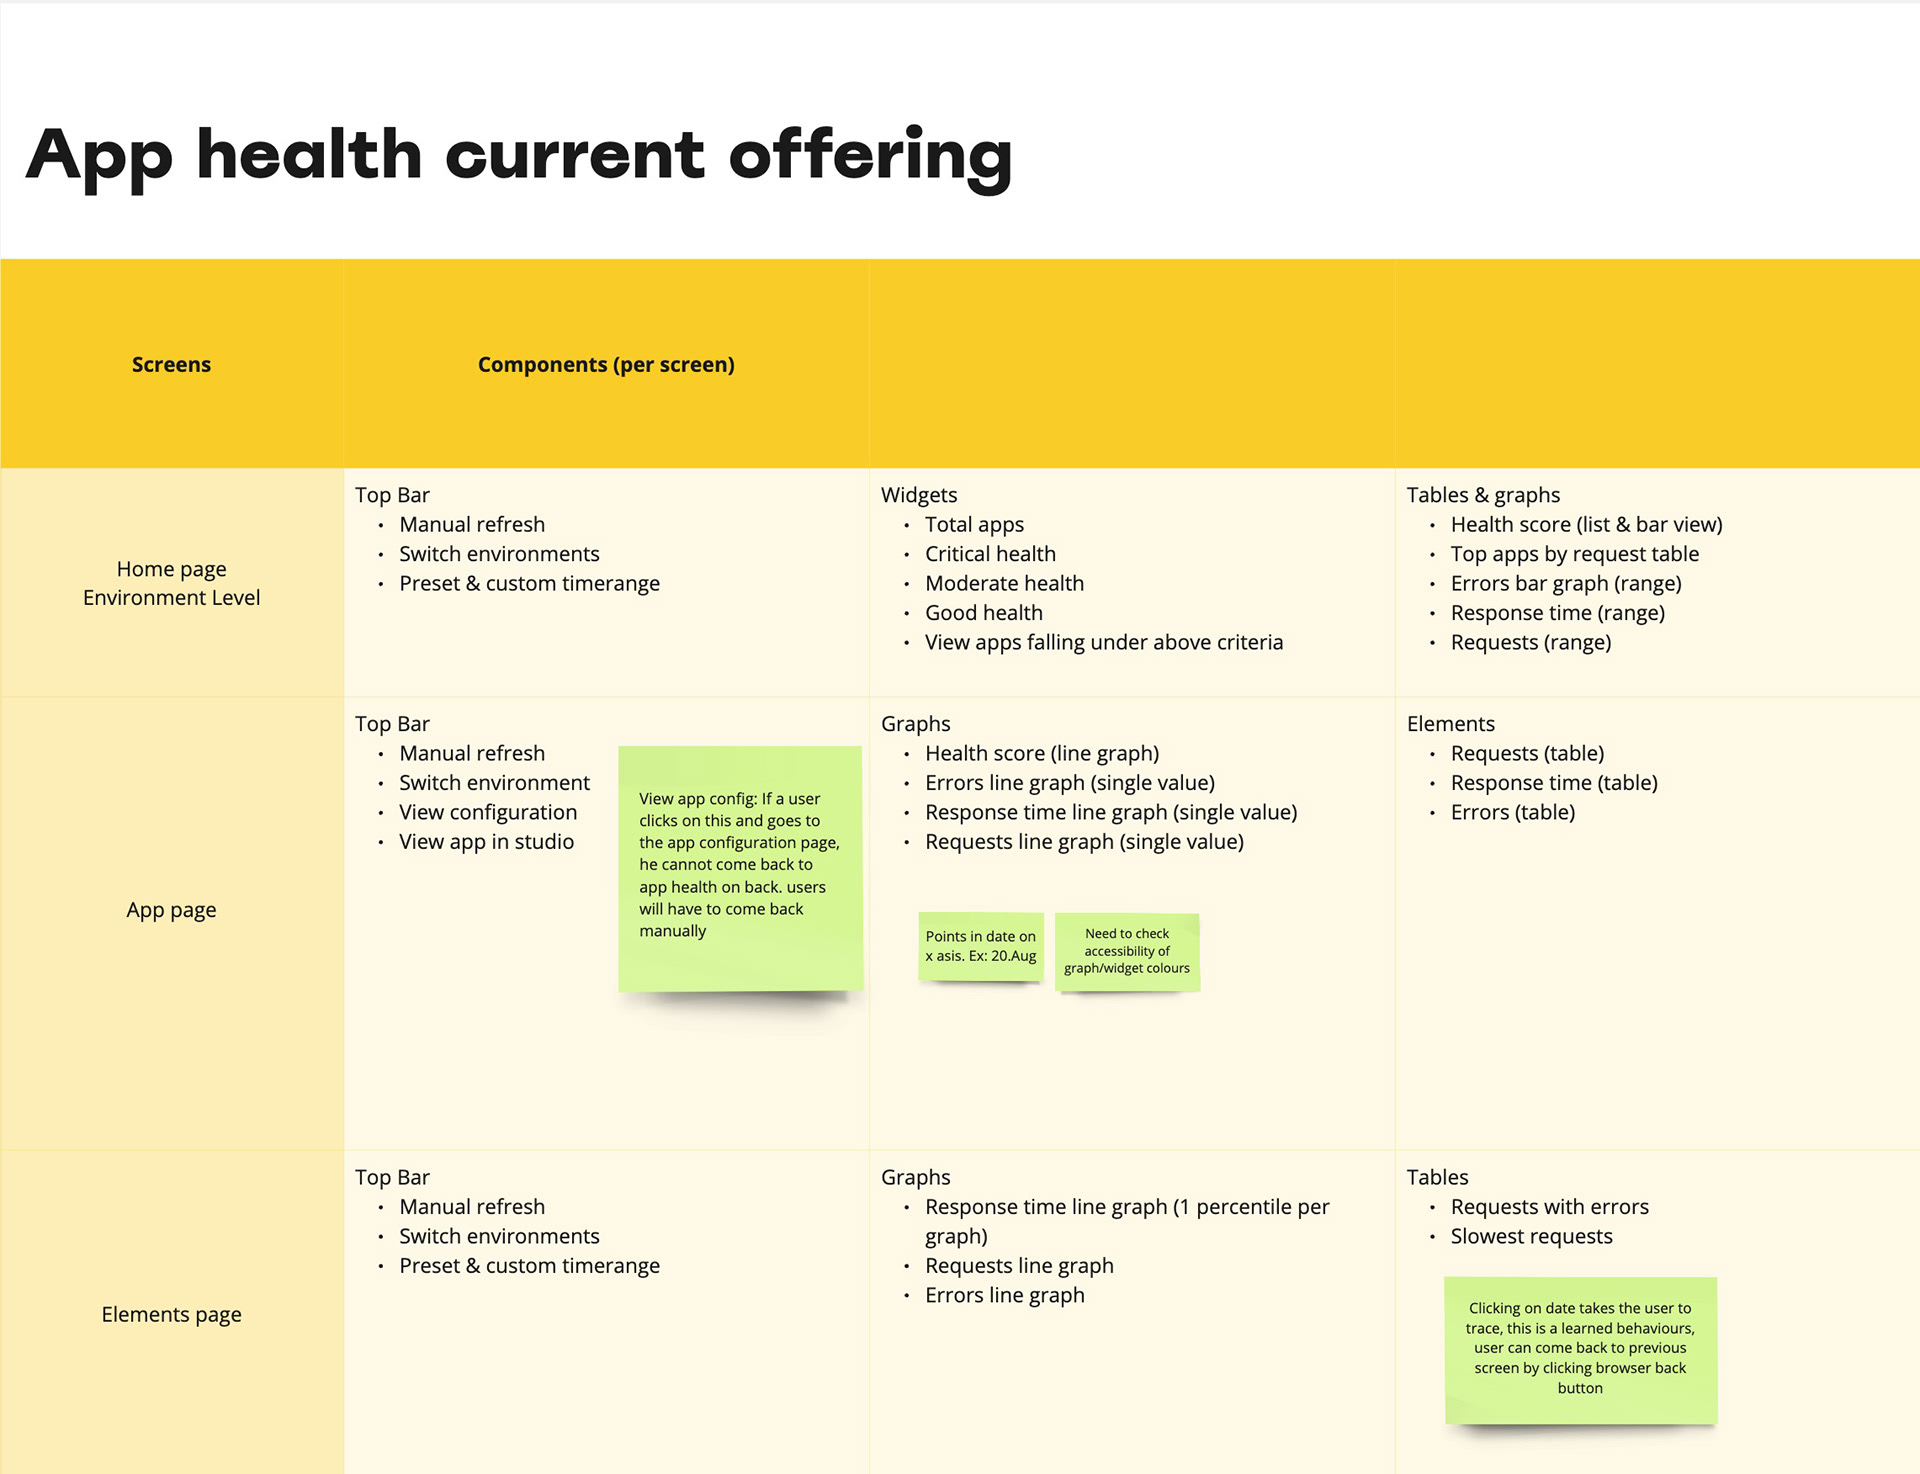
Current offering (Application health monitoring)
Outsystems developer cloud provides few vital monitoring & troubleshooting capabilities such as App health monitoring, traces, logs & code quality. Before jumping into user research, I studied current offerings as app health & usage features overlap in several tools.
This helped me understand
1. What was already available to avoid repetitions in new capability
2. Potential positioning of Digital experience monitoring, as an independent capability or a subset of a capability which already exists
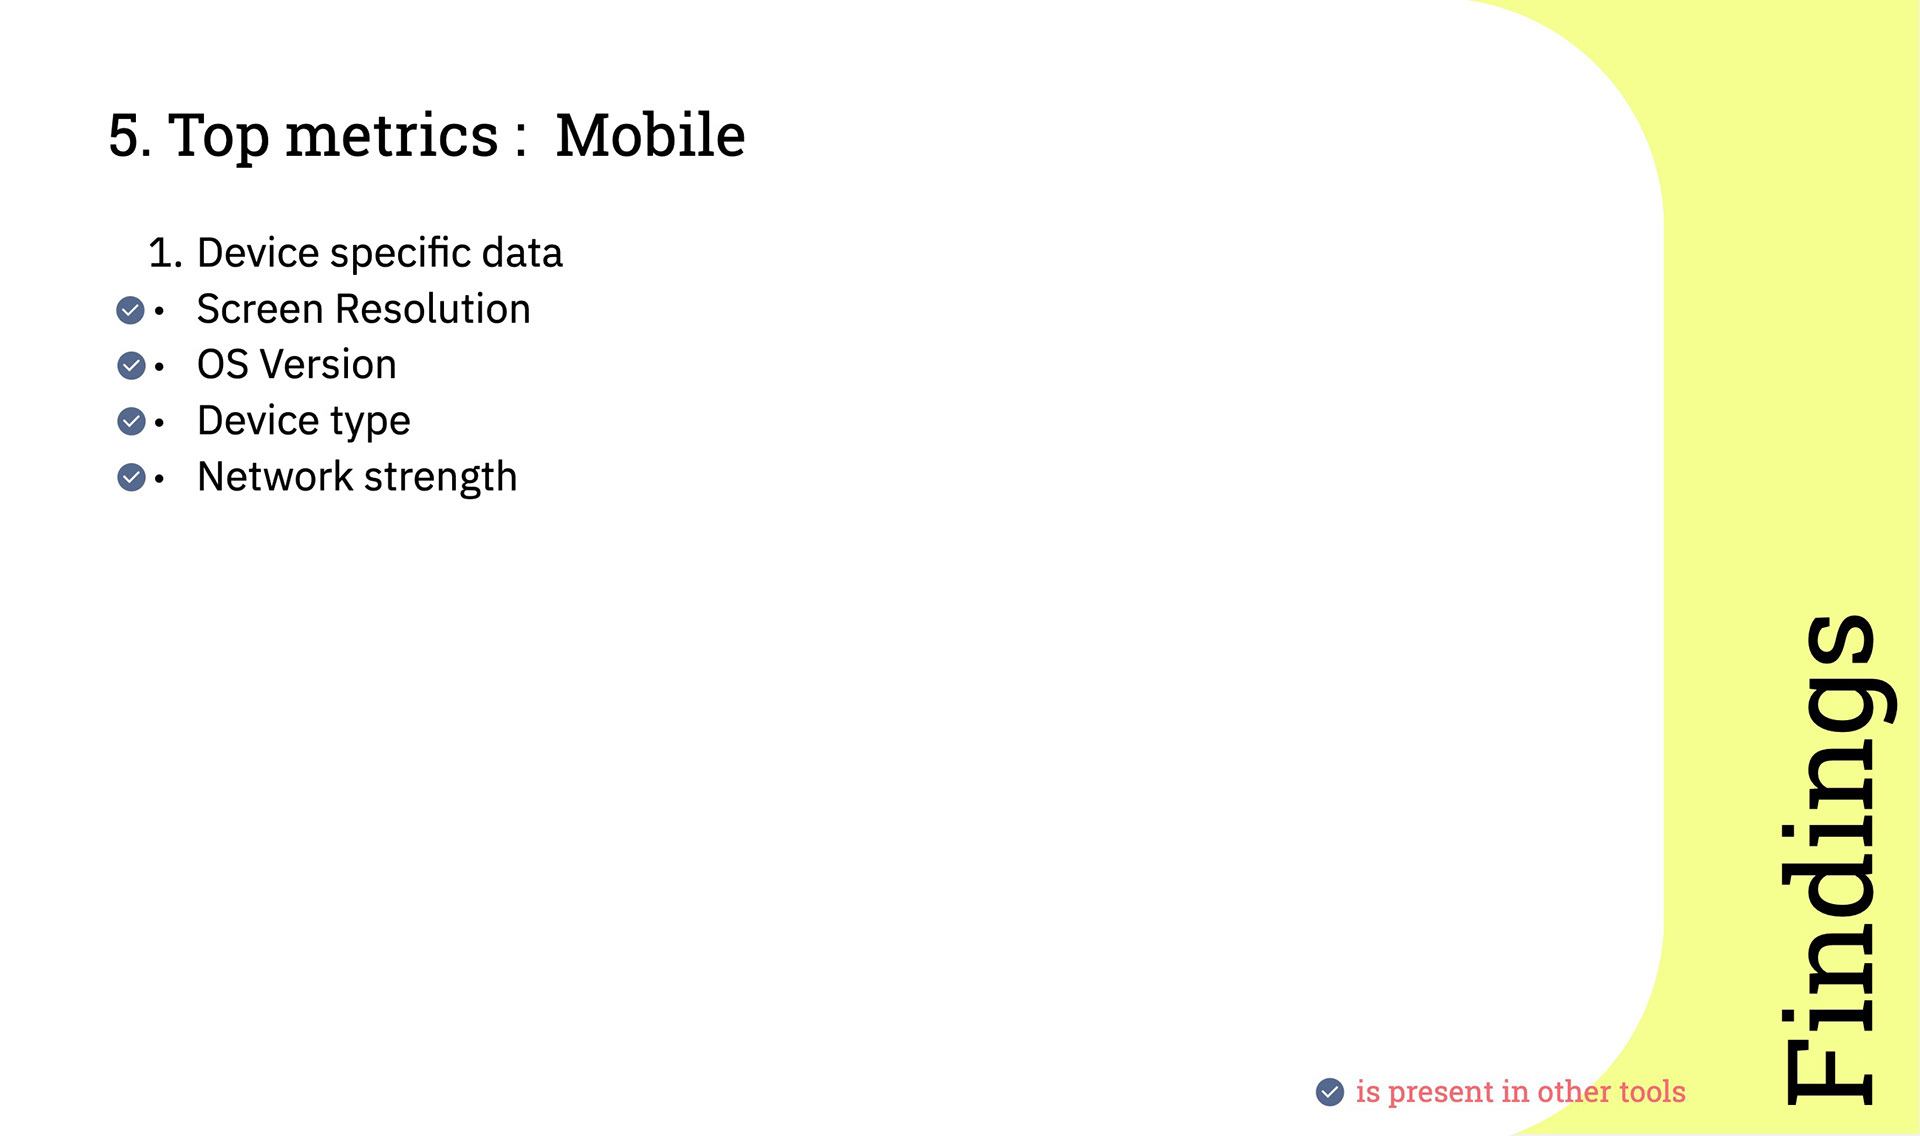
Problem definition | Understanding DEM for mobile apps
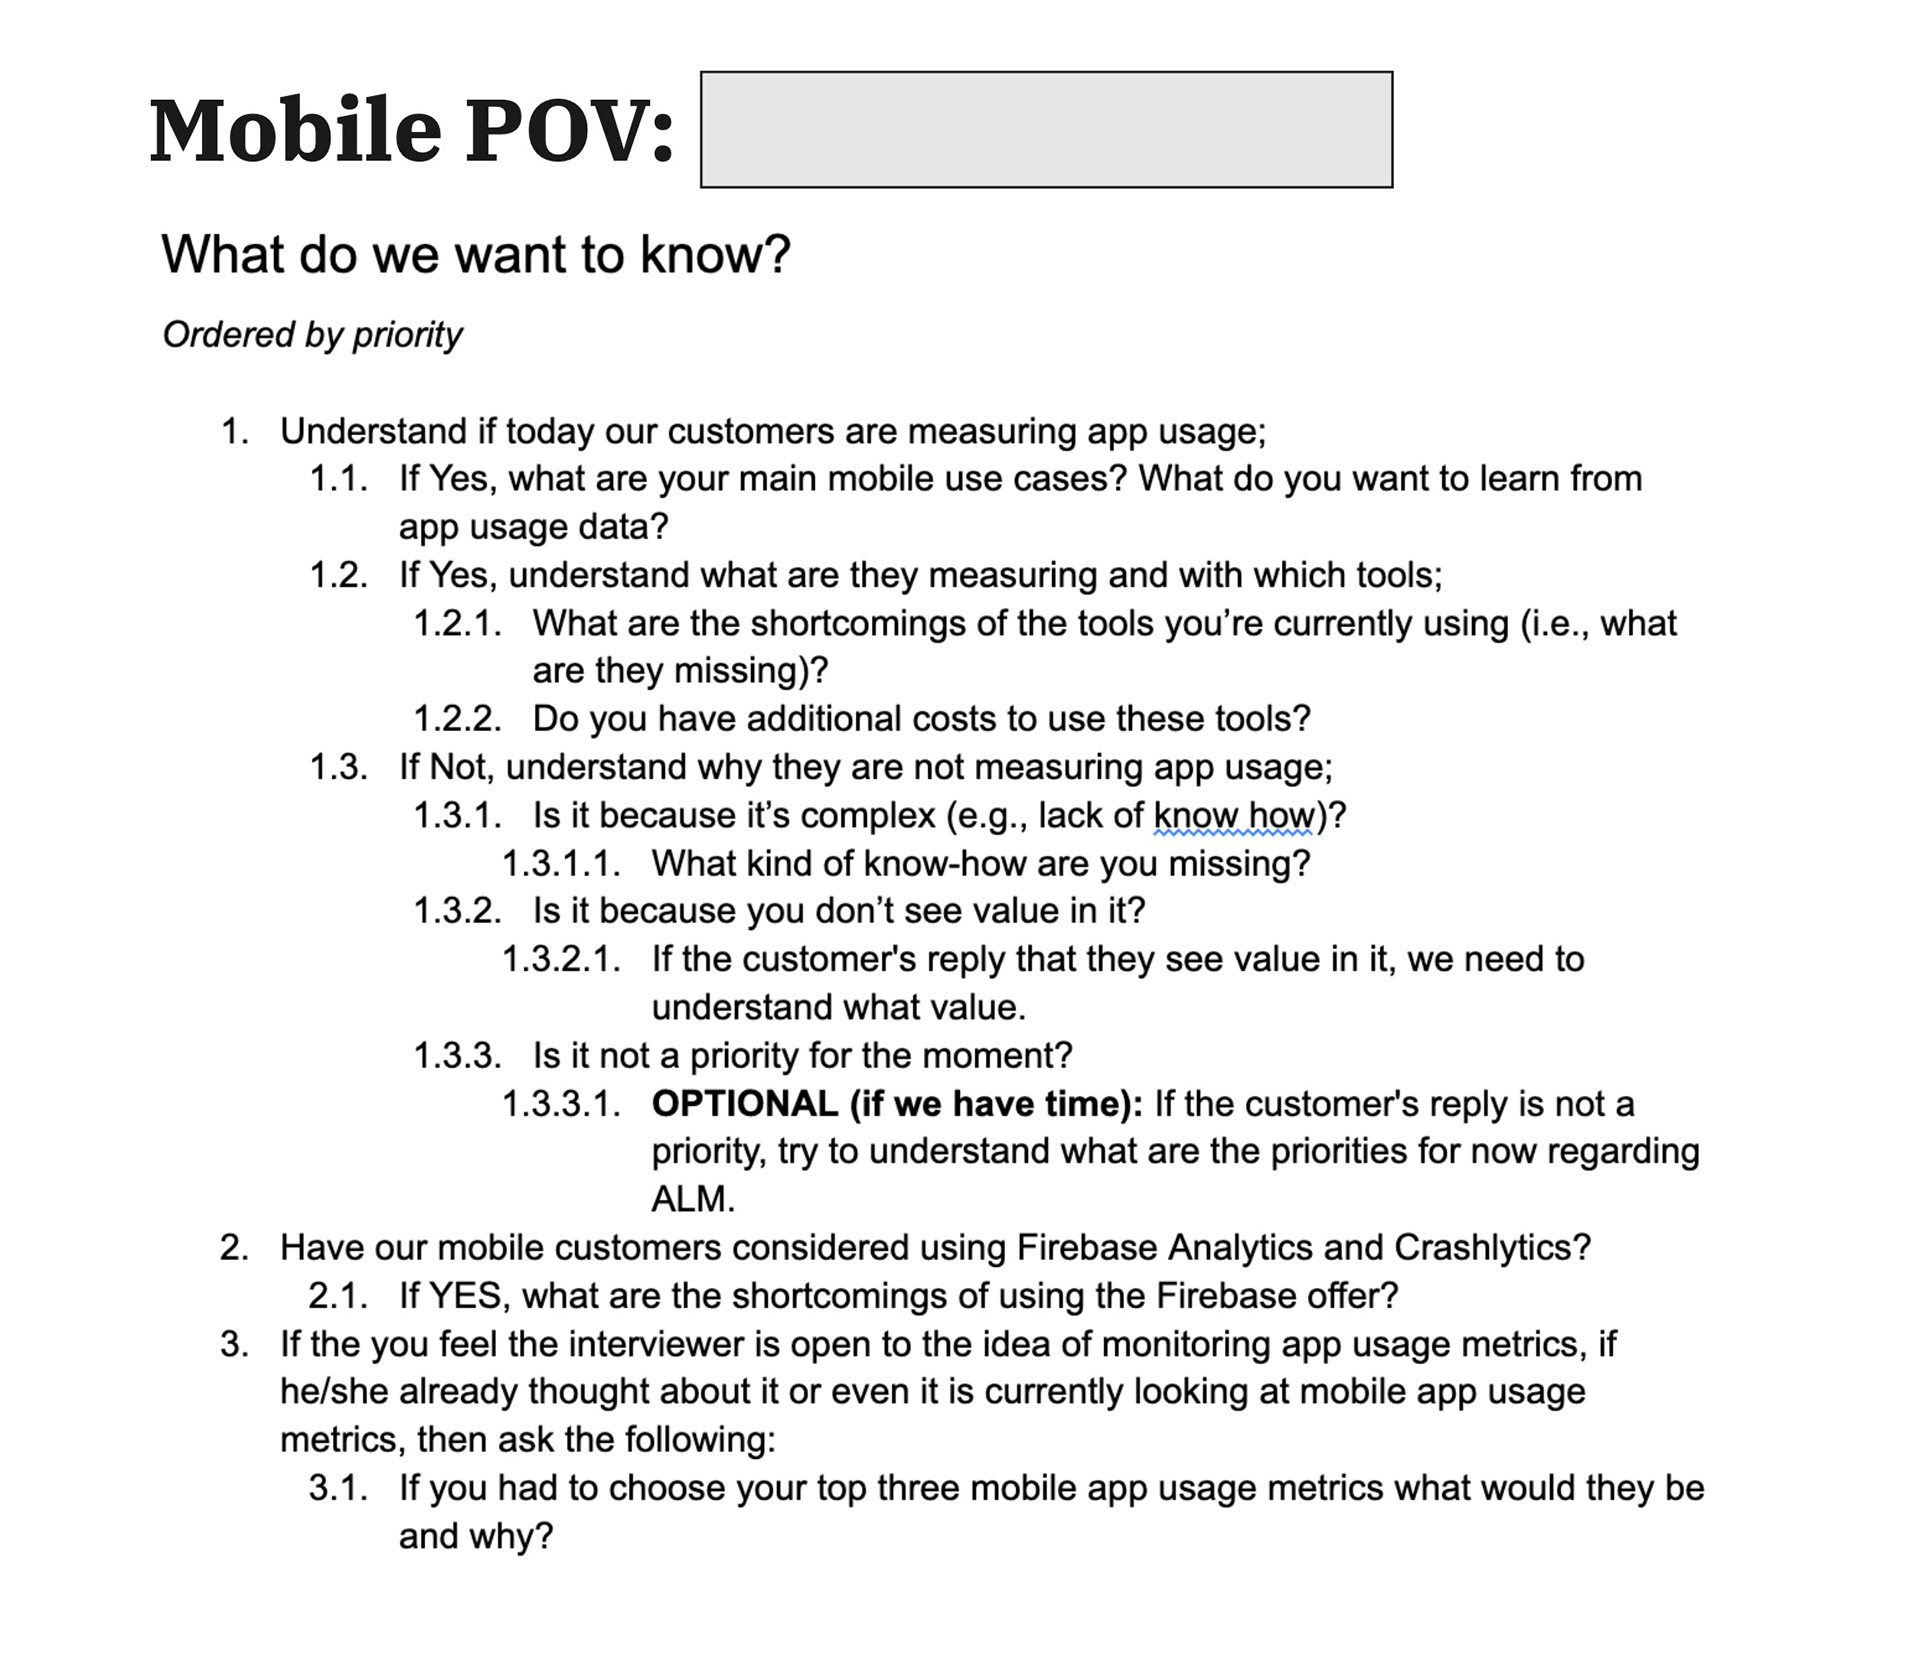
In the contextual research phase, I consulted mobile app experience team to understand what would be the needs of digital monitoring from a mobile application perspective.
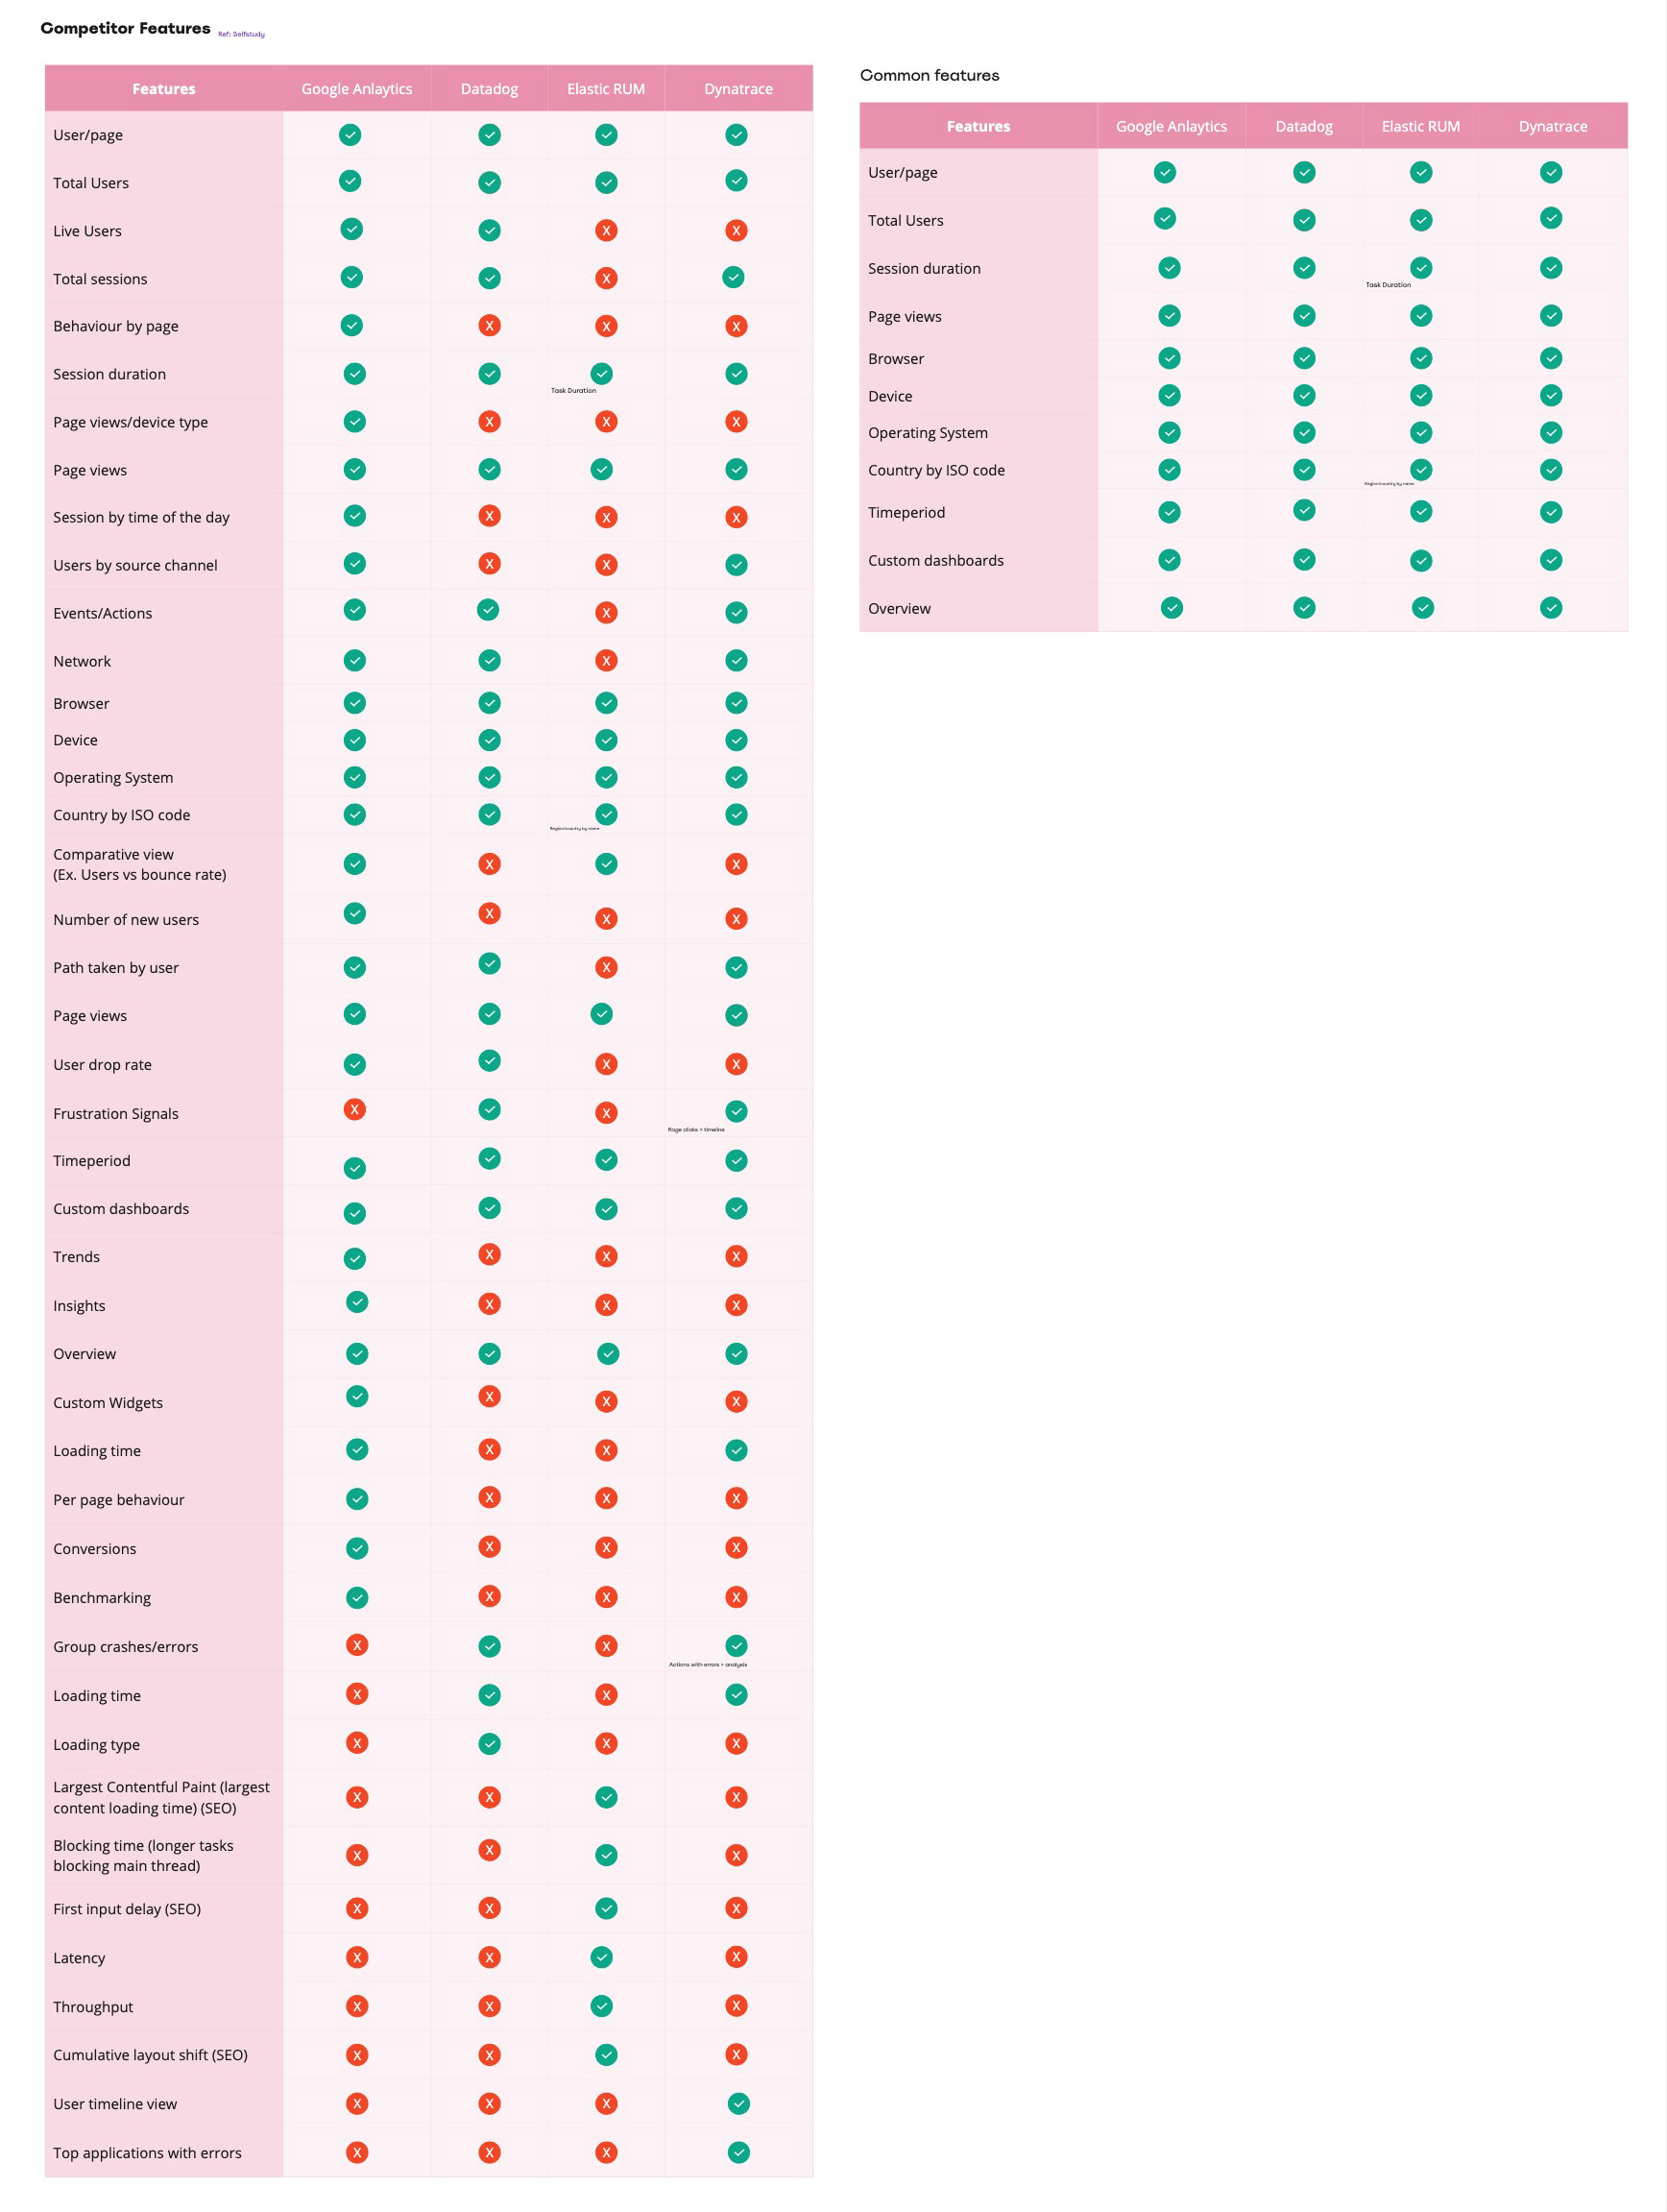
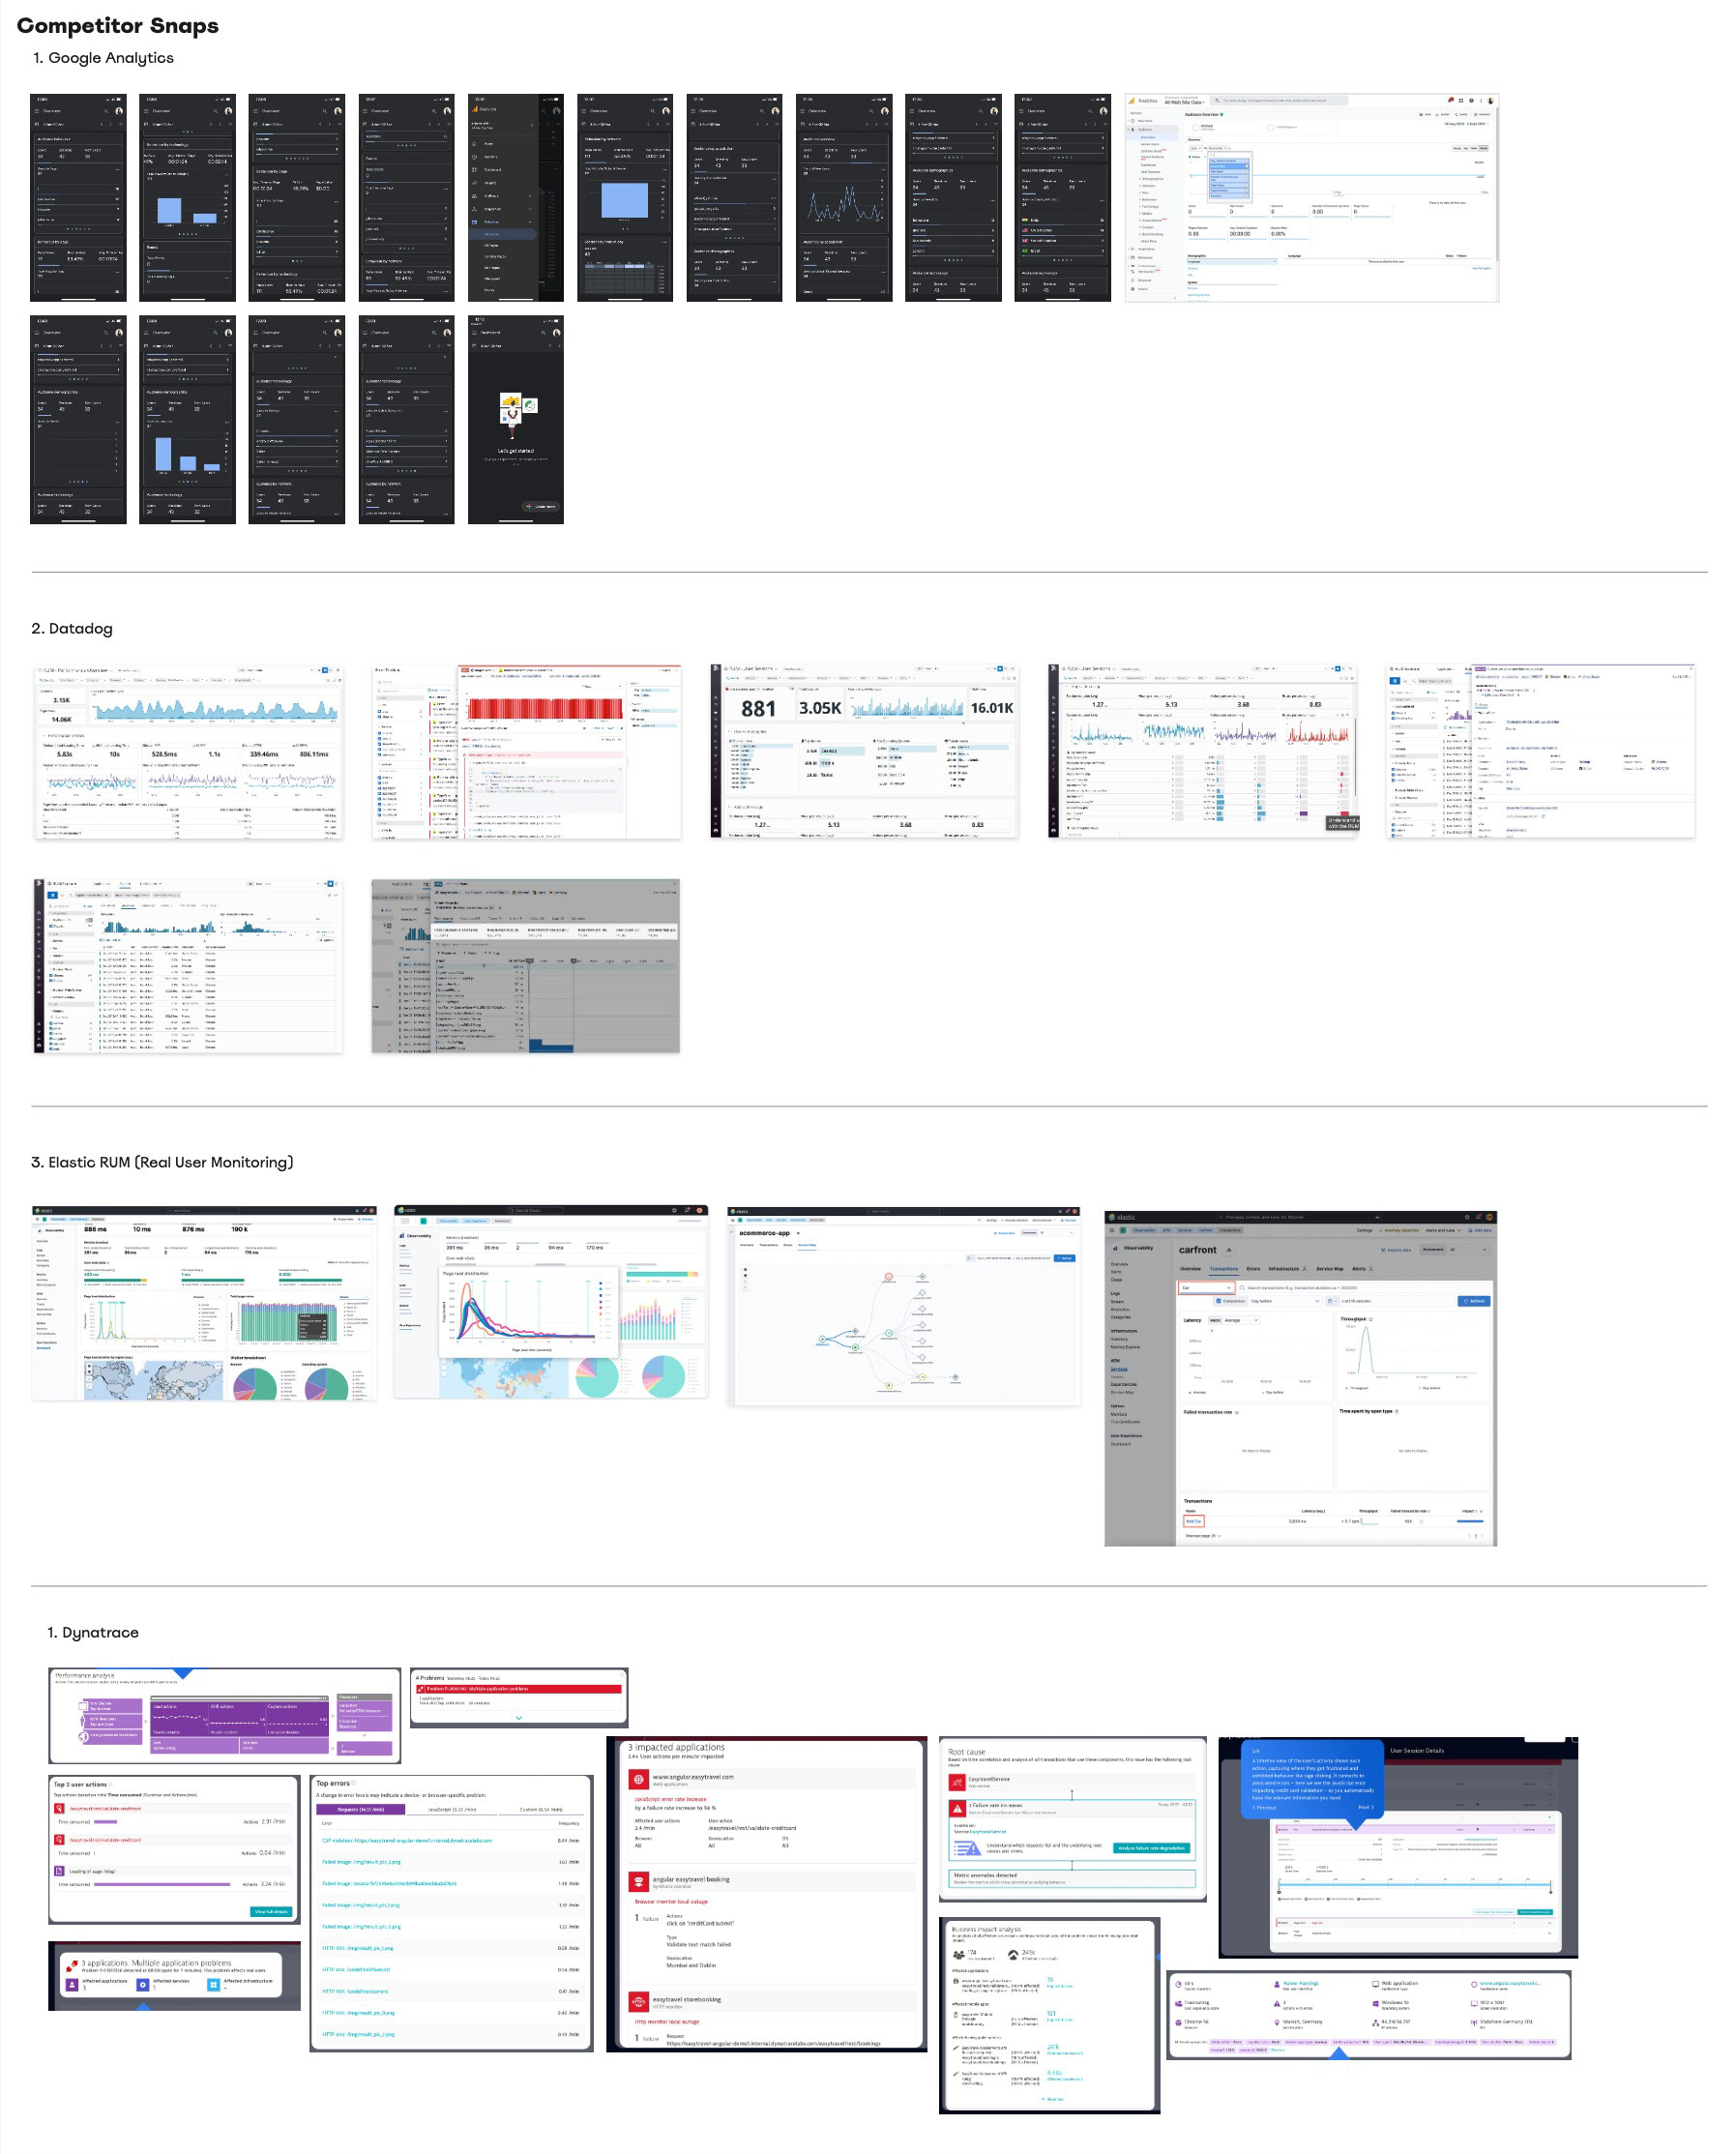
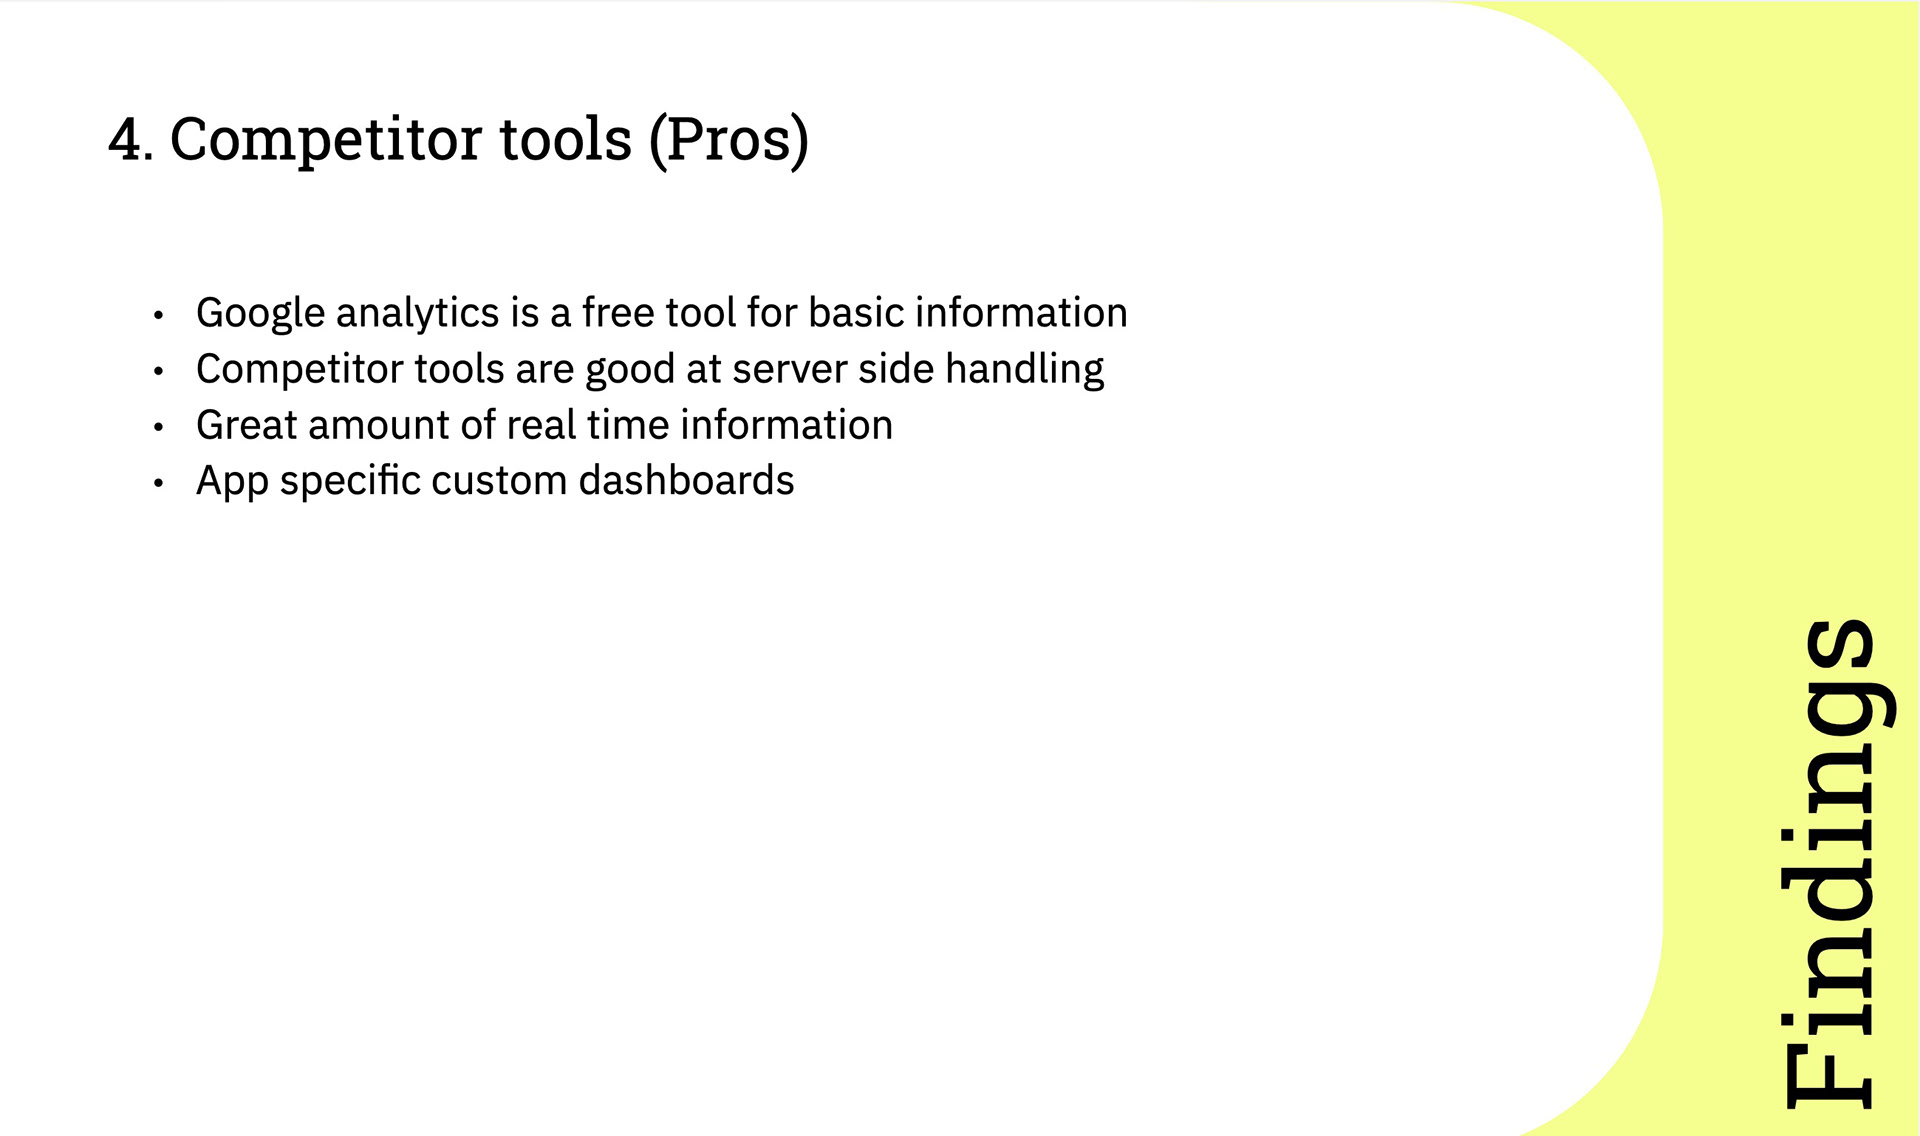
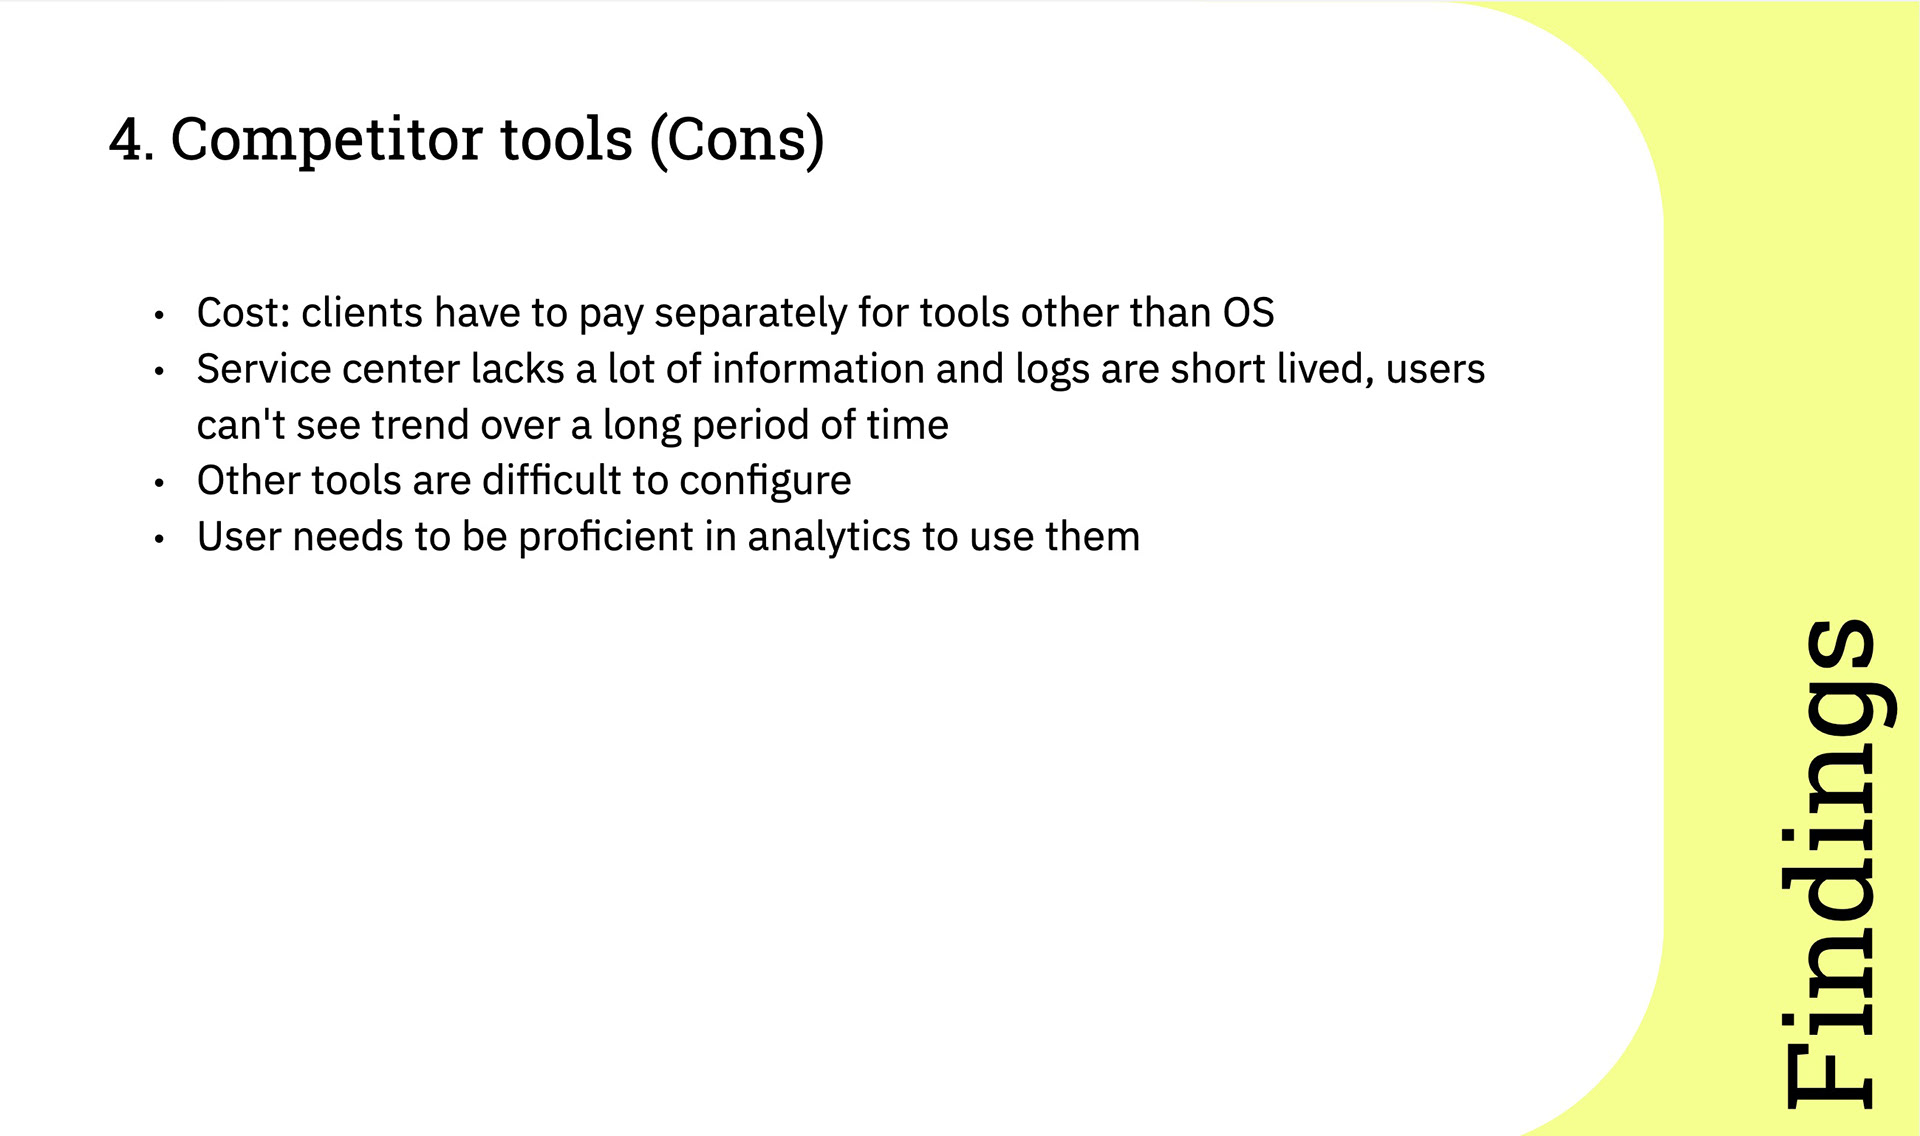
Problem definition | Competitor study
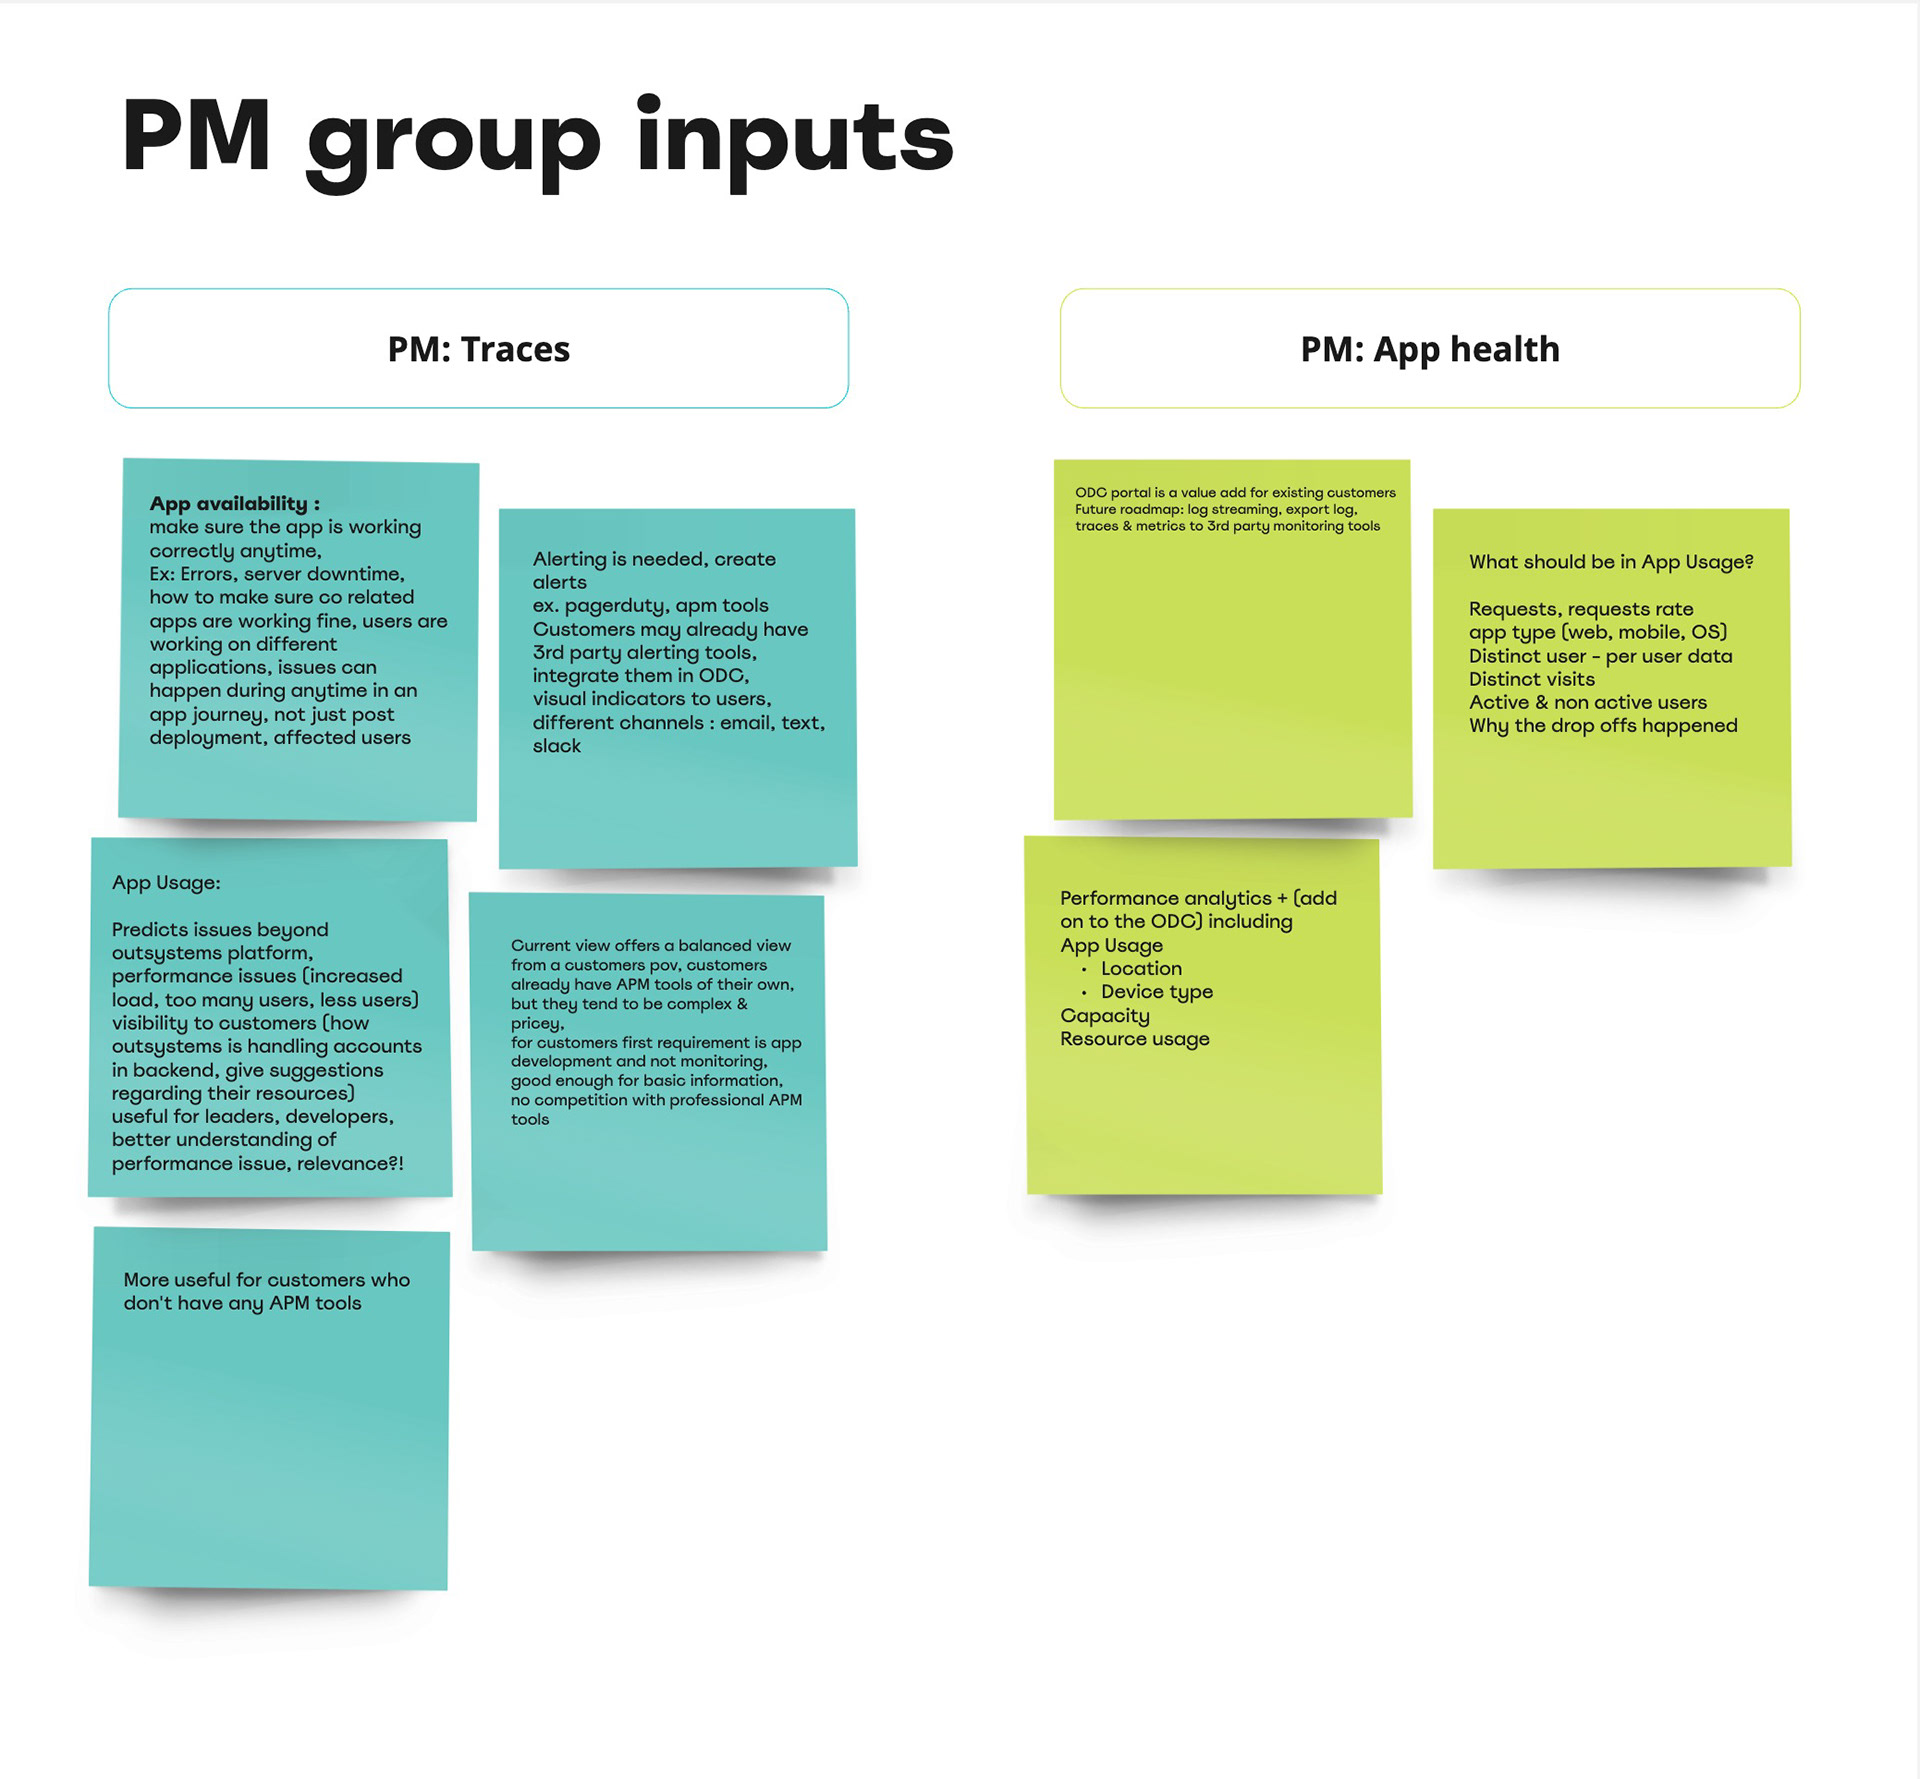
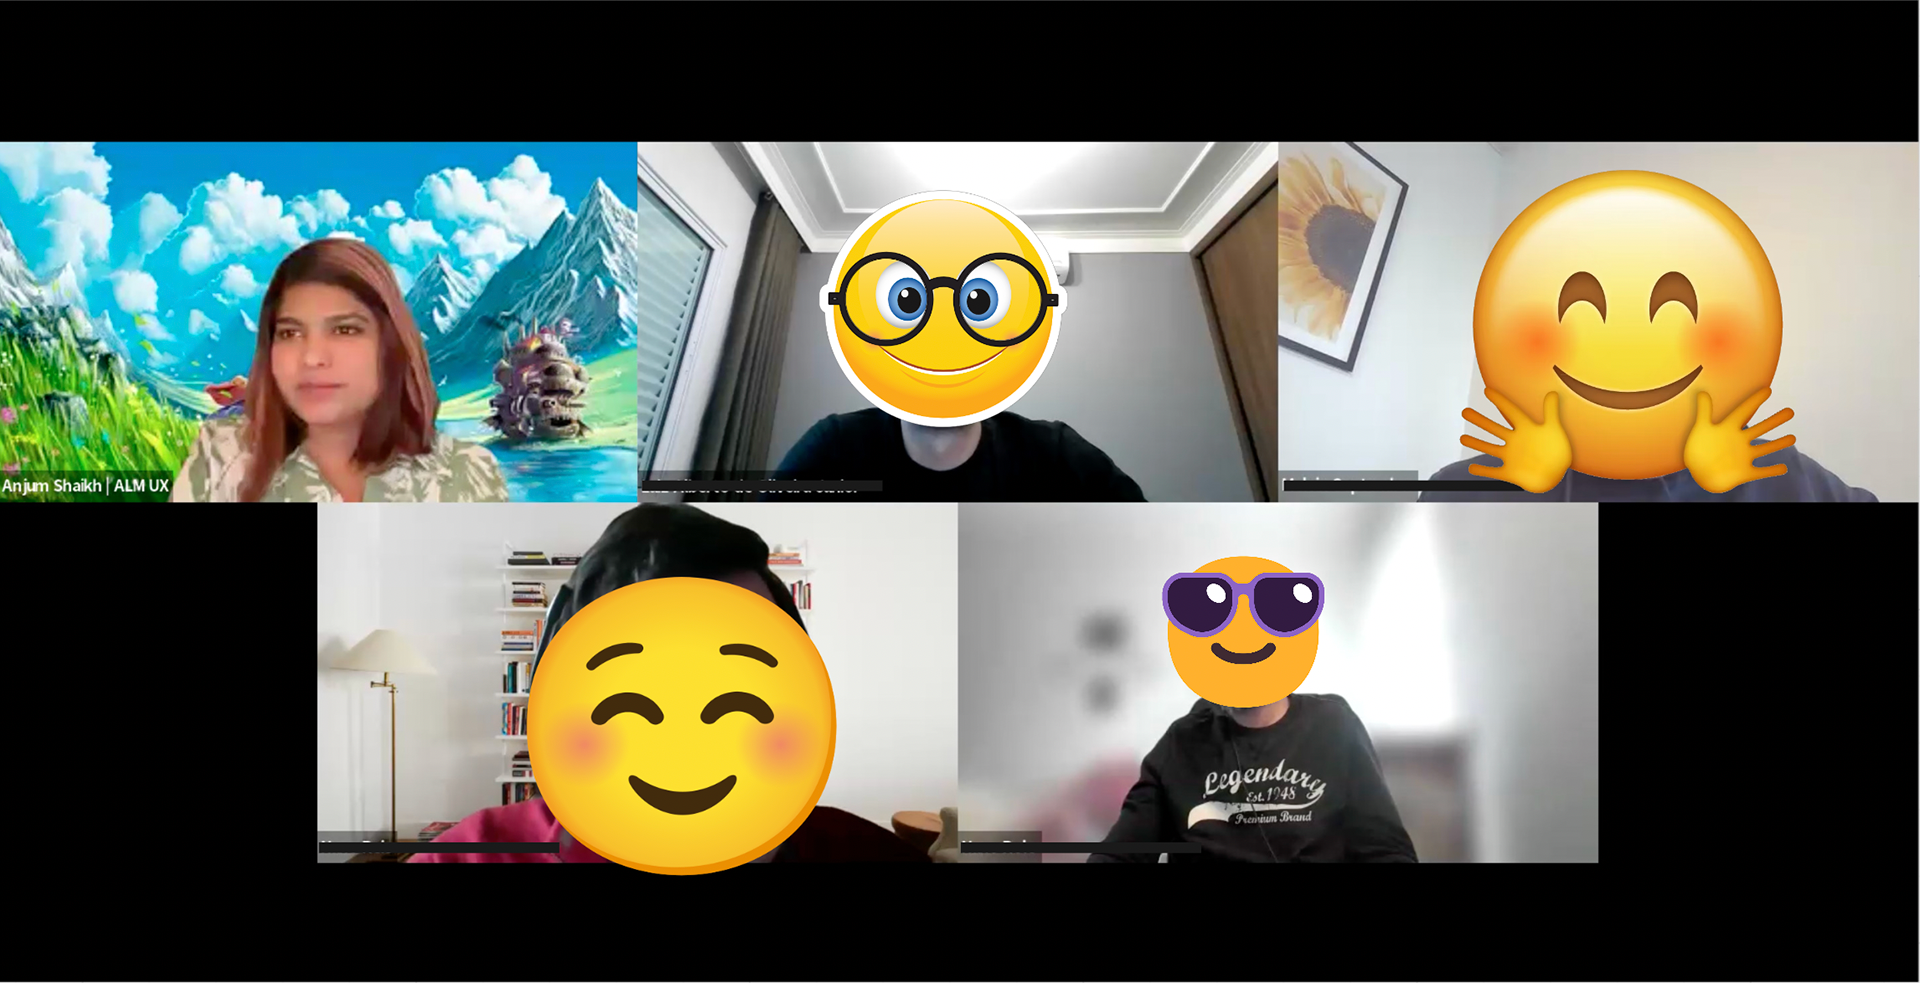
Problem definition | User interviews

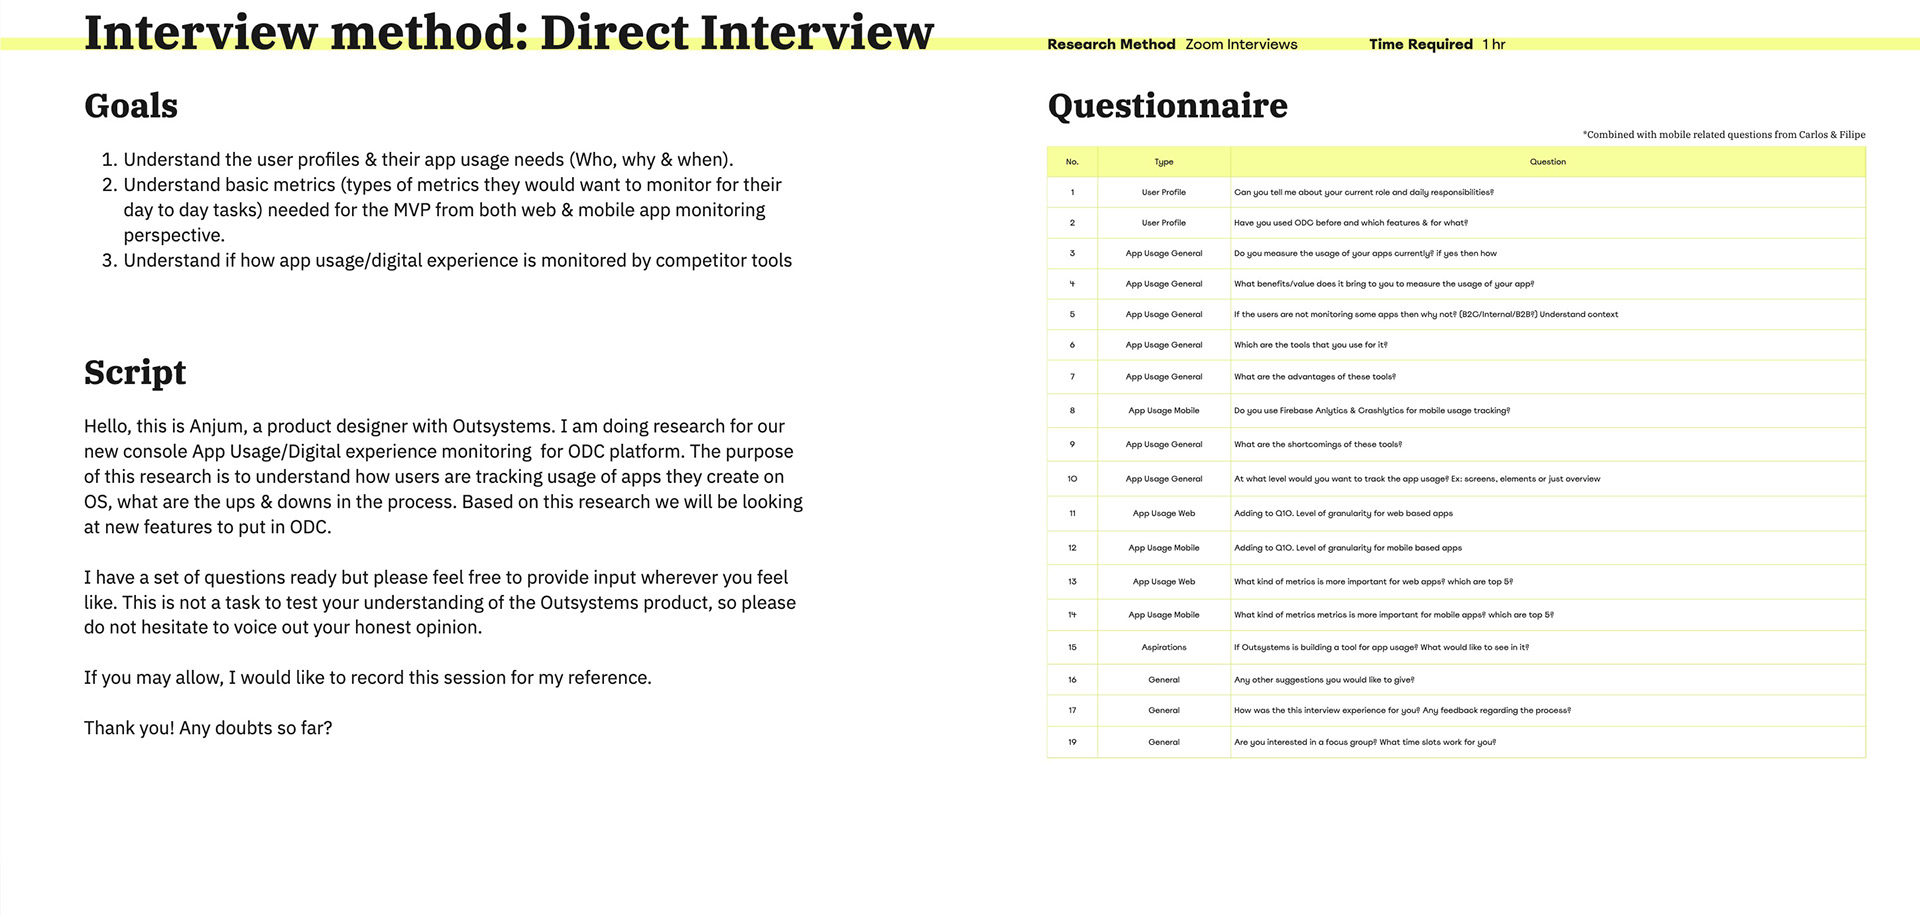


User interviews
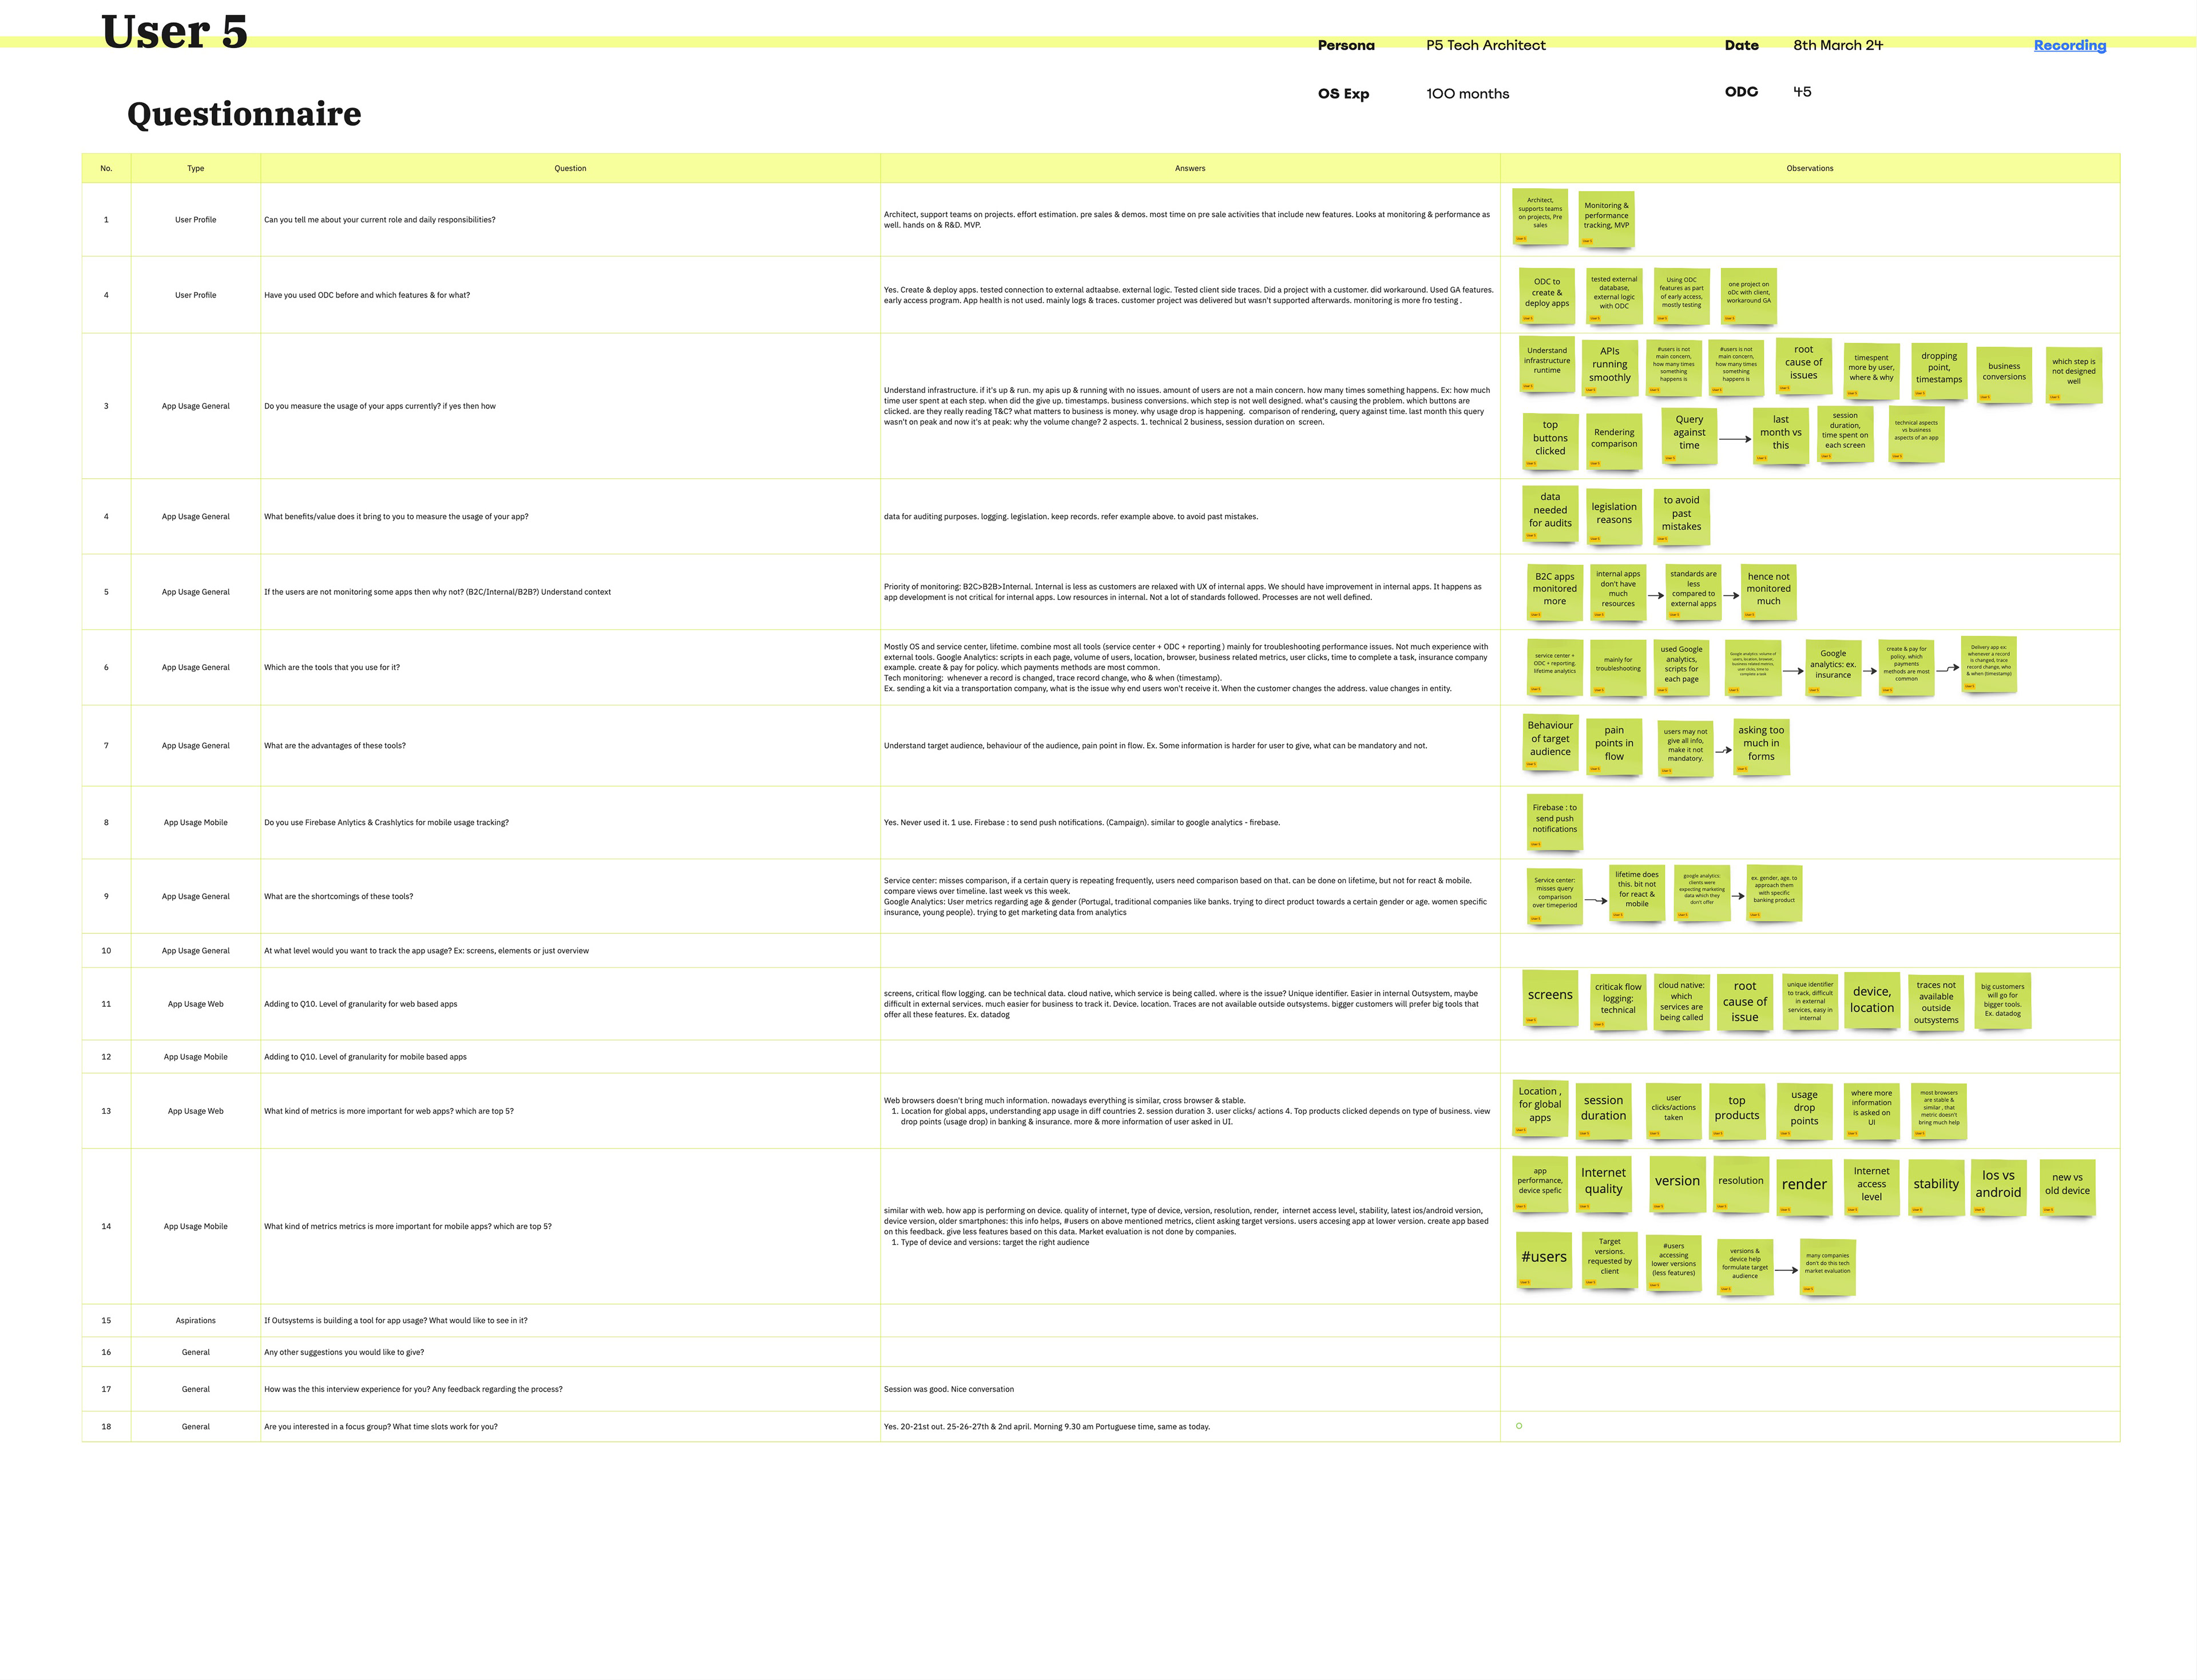
User interviews
Problem definition | Ideation sessions with real users (The 6-3-5 method)
During the user interviews, I discovered that the users were highly interested in the potential of this new feature being introduced to Outsystems. In order to go deeper into their thoughts, I organised an ideation session with the same users who had been interviewed. This created a conducive and inclusive environment that fostered active participation from everyone involved. We actively embraced unconventional ideas and built upon them, while also encouraging all participants to fully contribute, resulting in a diverse range of innovative solutions. The ideation process utilised the 6-3-5 method, with an additional step allowing participants to present and receive constructive criticism on each other's ideas.

Ice-breaker activity
Brainstorming with partipants

Ideation session output
After conducting thorough interviews with high-quality users from each persona, an affinity diagram was created to analyze the responses for this new capability.
Problem definition | Affinity mapping & analysis
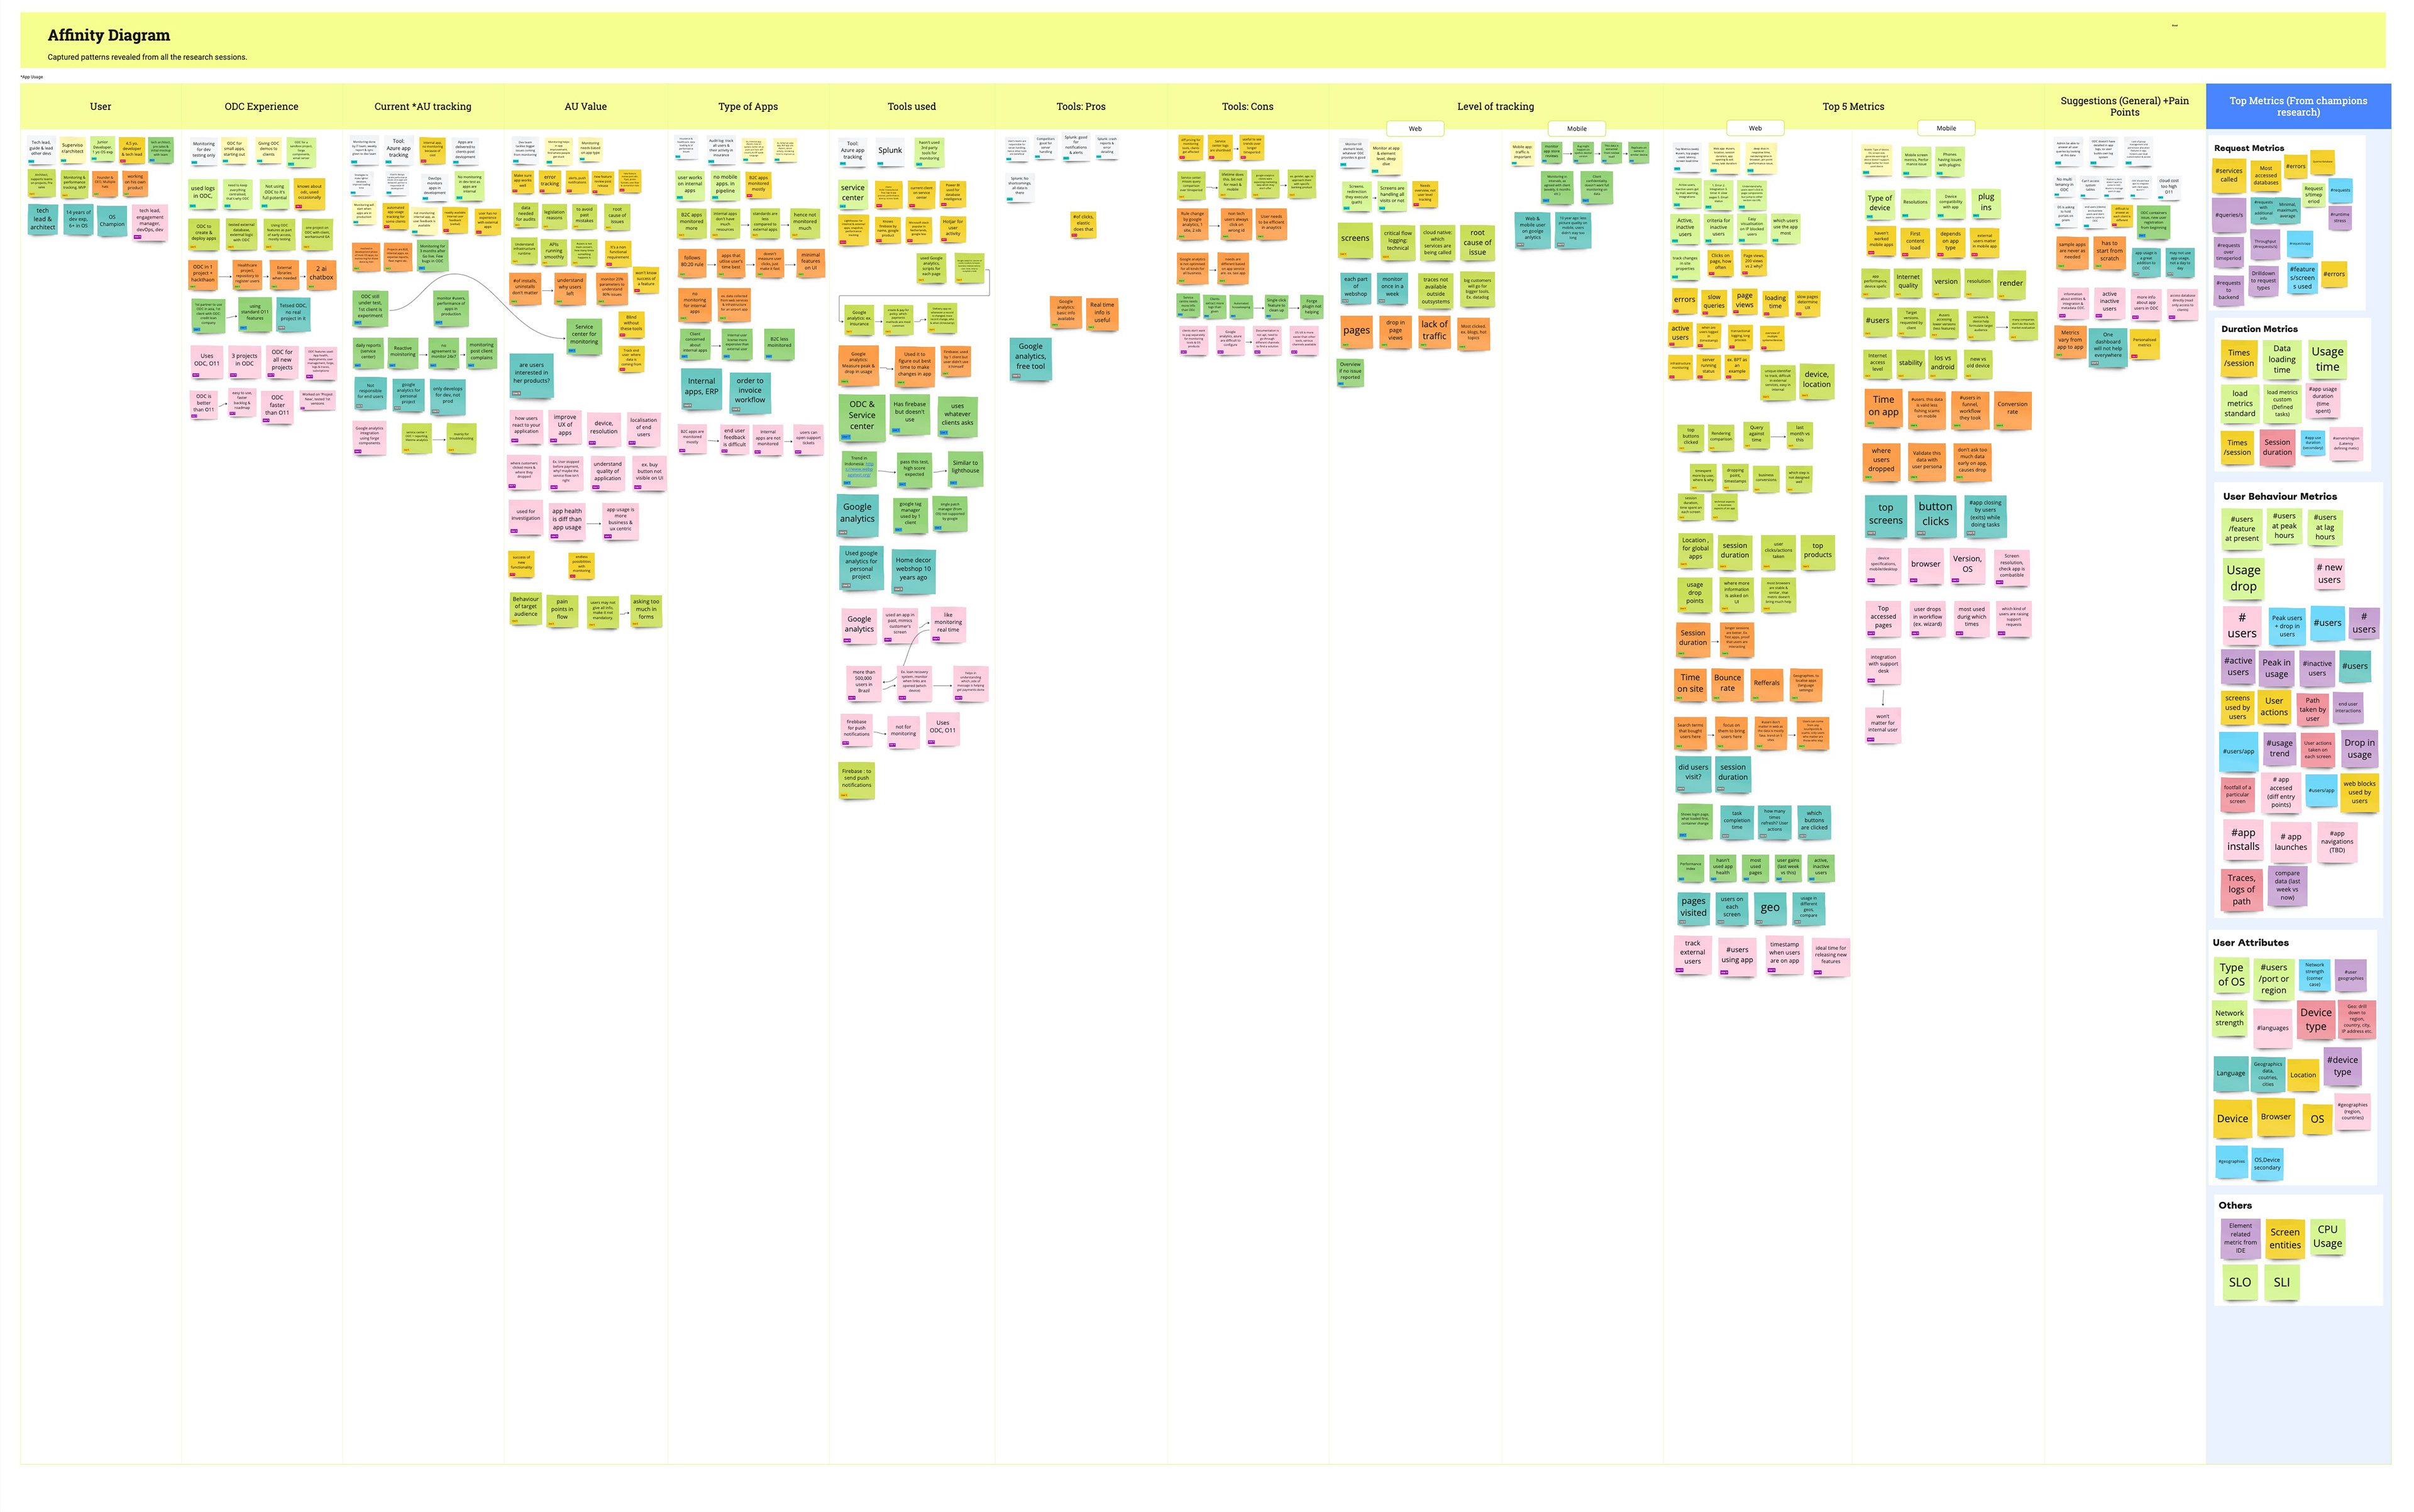
The critical analysis points were extracted from the affinity diagram & ideation session and presented in a user-friendly format. These findings were then shared with Product Managers, POs, and engineering teams to gain deeper insights into the project. Additionally, this process helped illuminate any existing UX issues throughout the product.
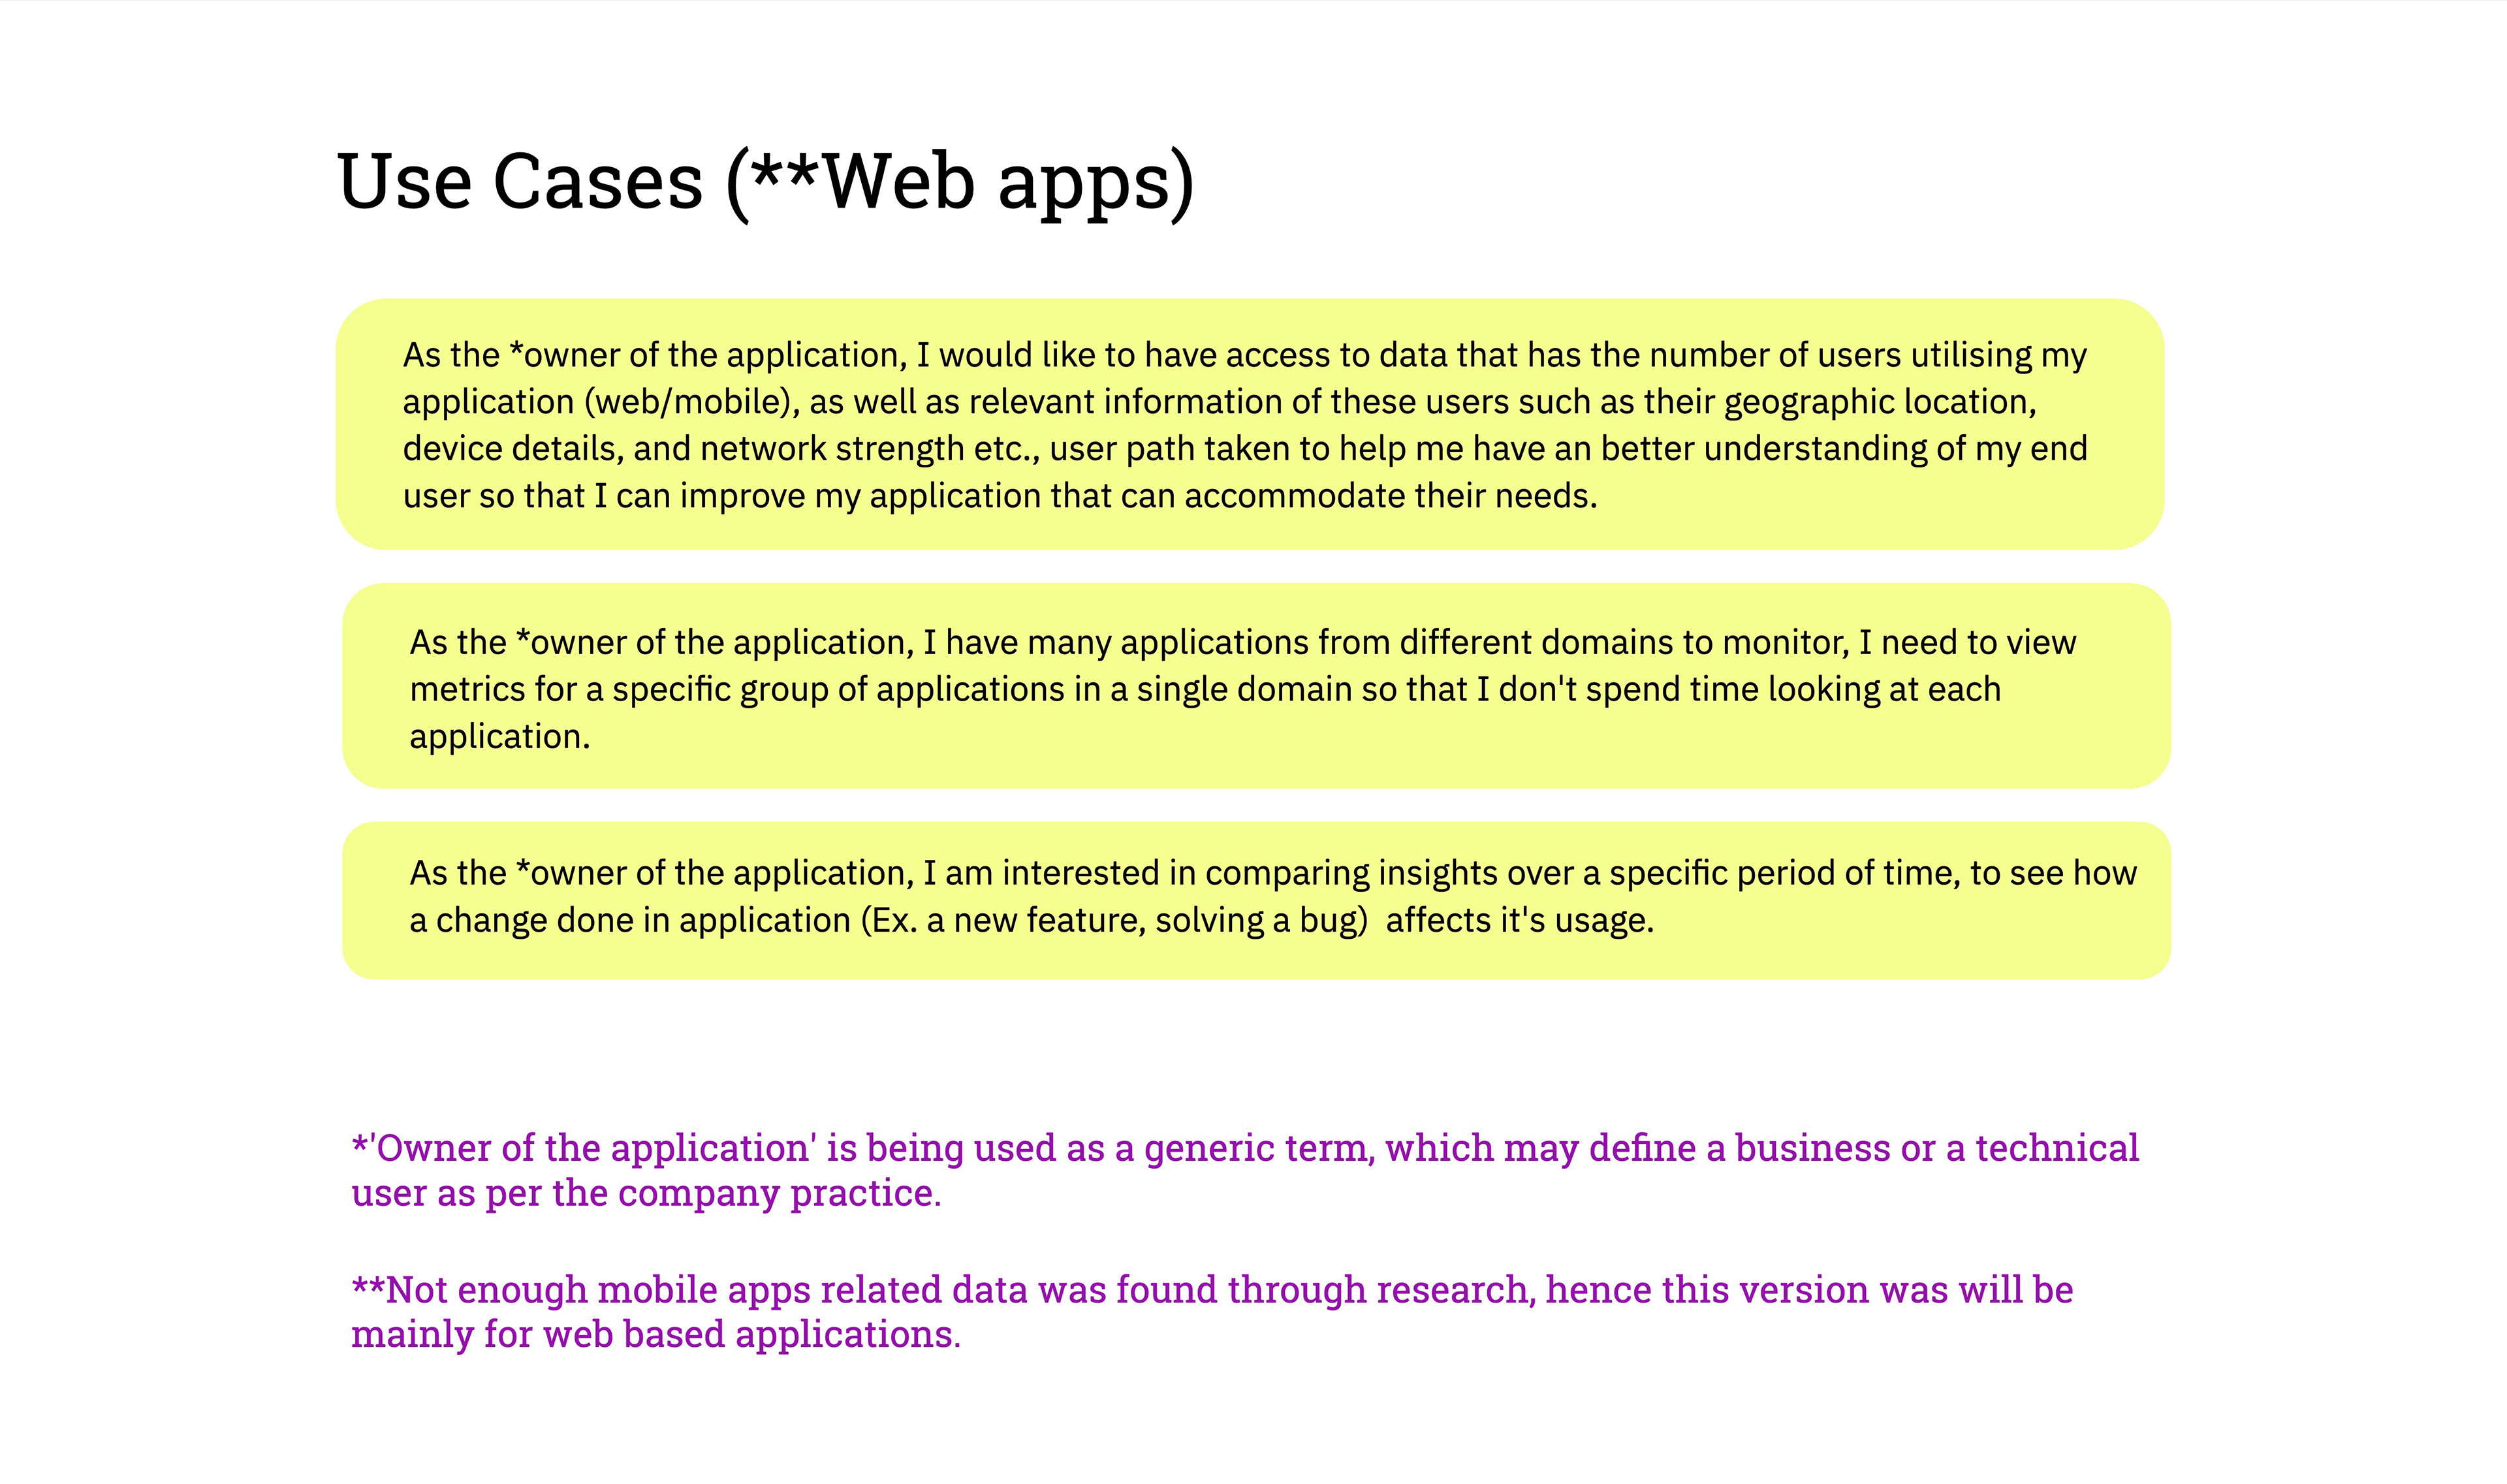
Problem definition | Research findings & next steps
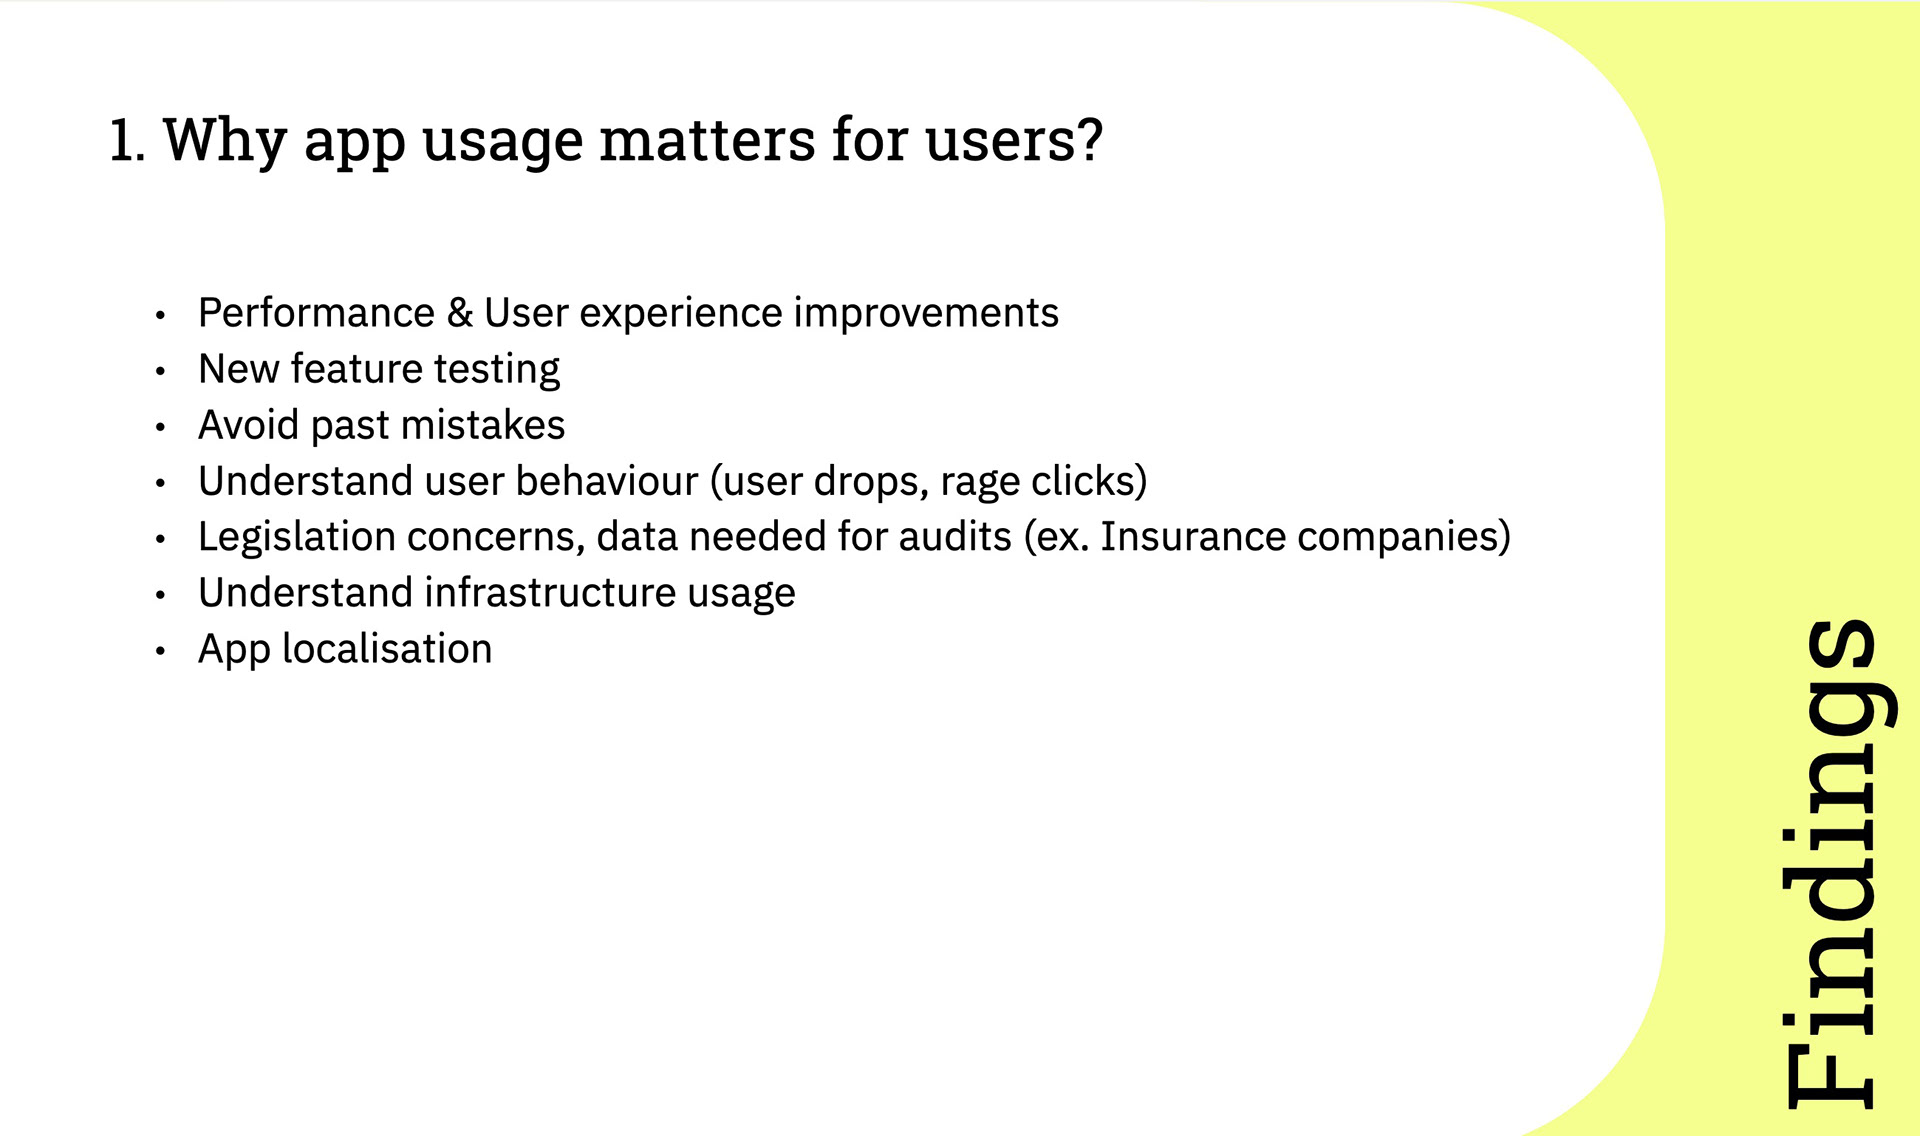
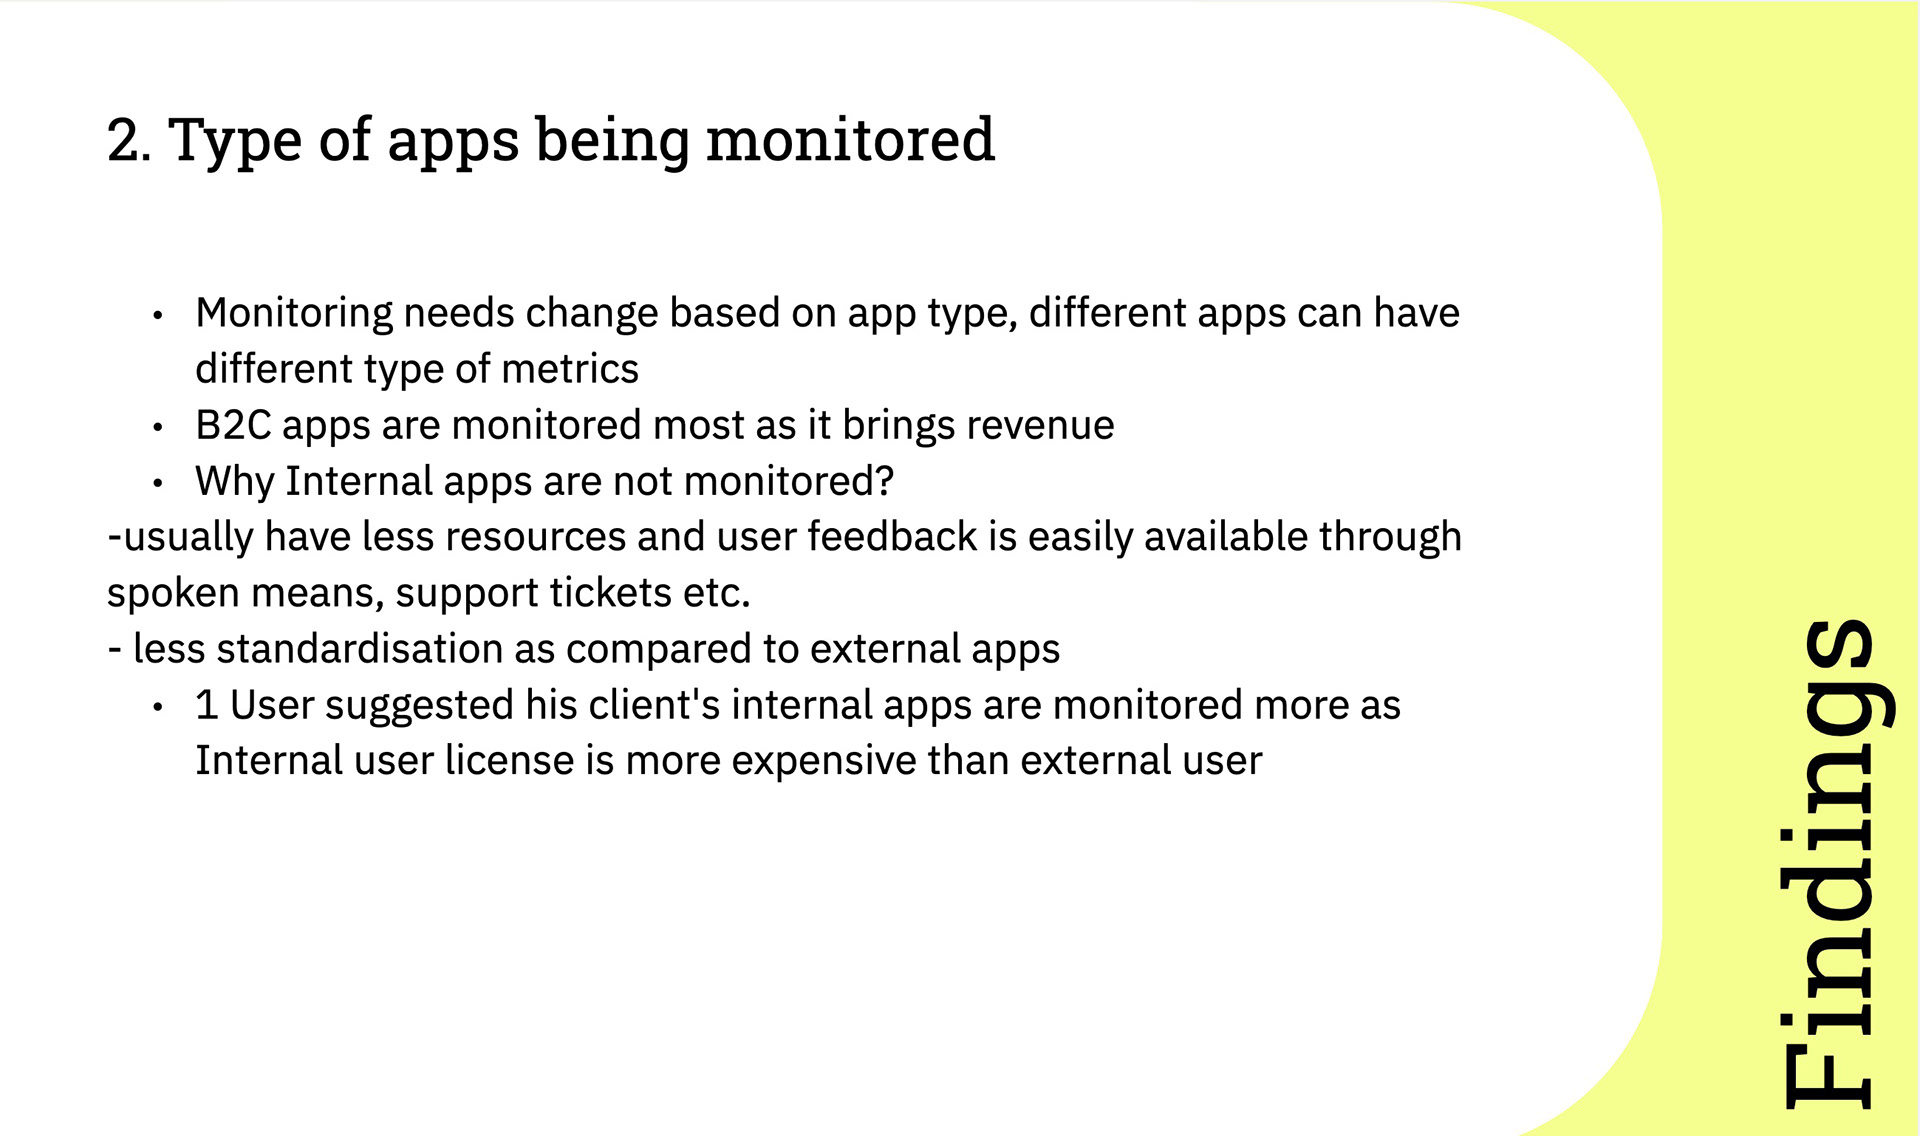

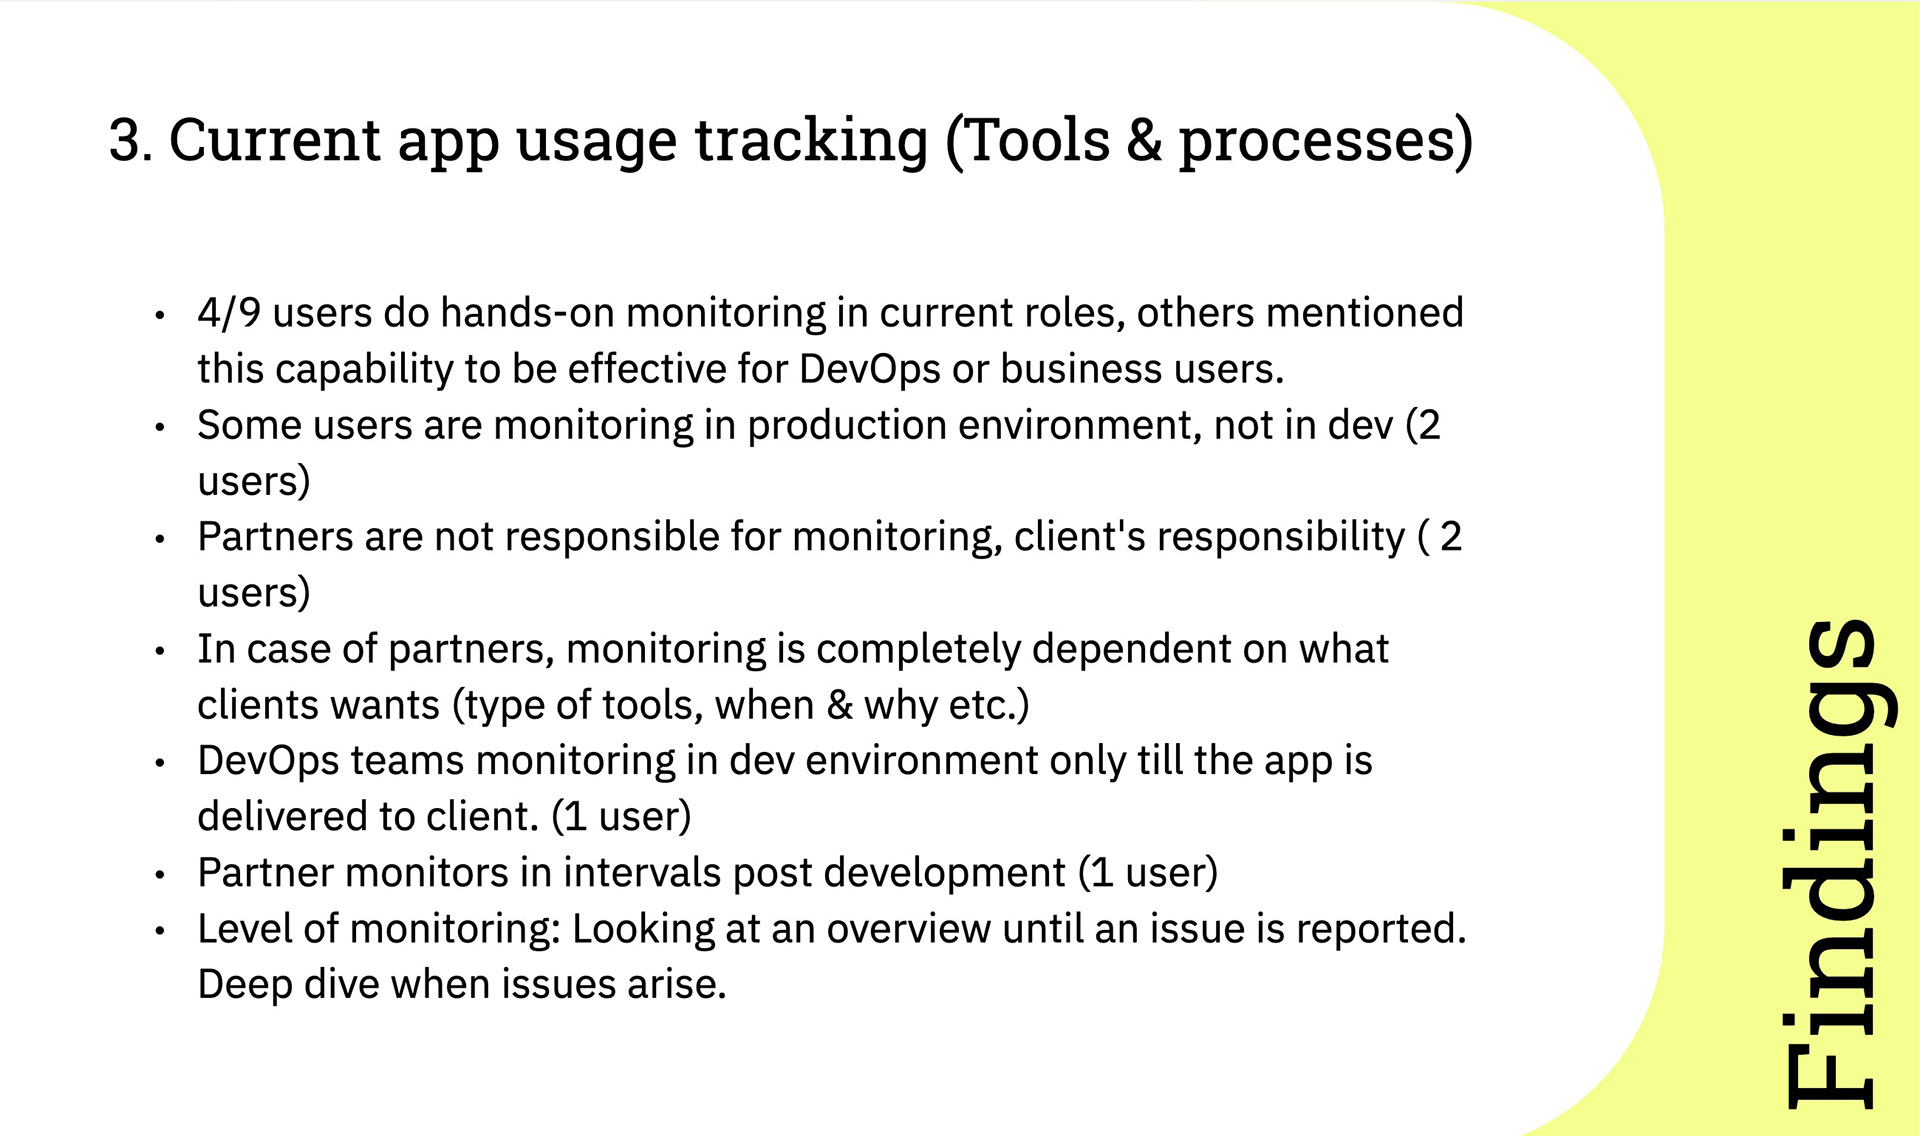

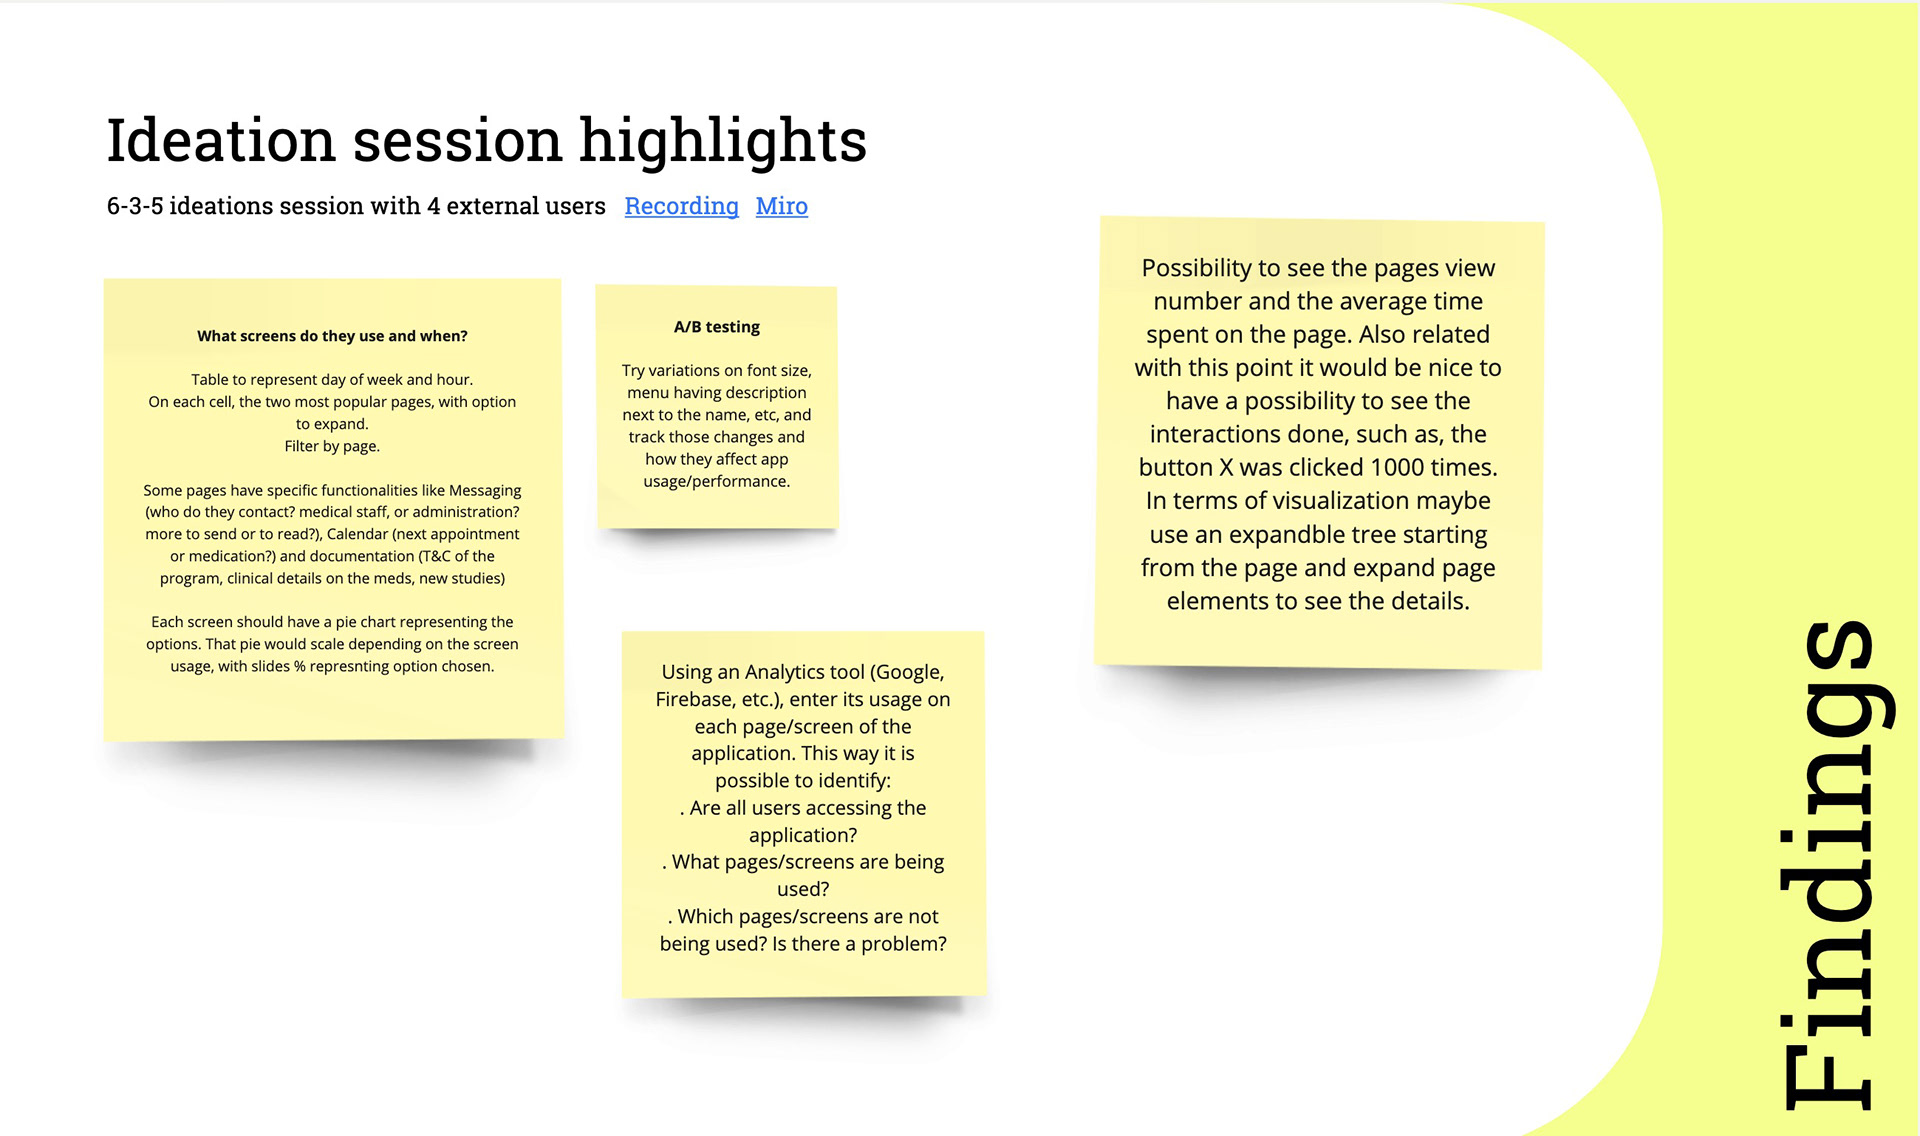
Findings helped finalise on main use cases for starting with low fidelity wireframes.
Solution design|Ideation
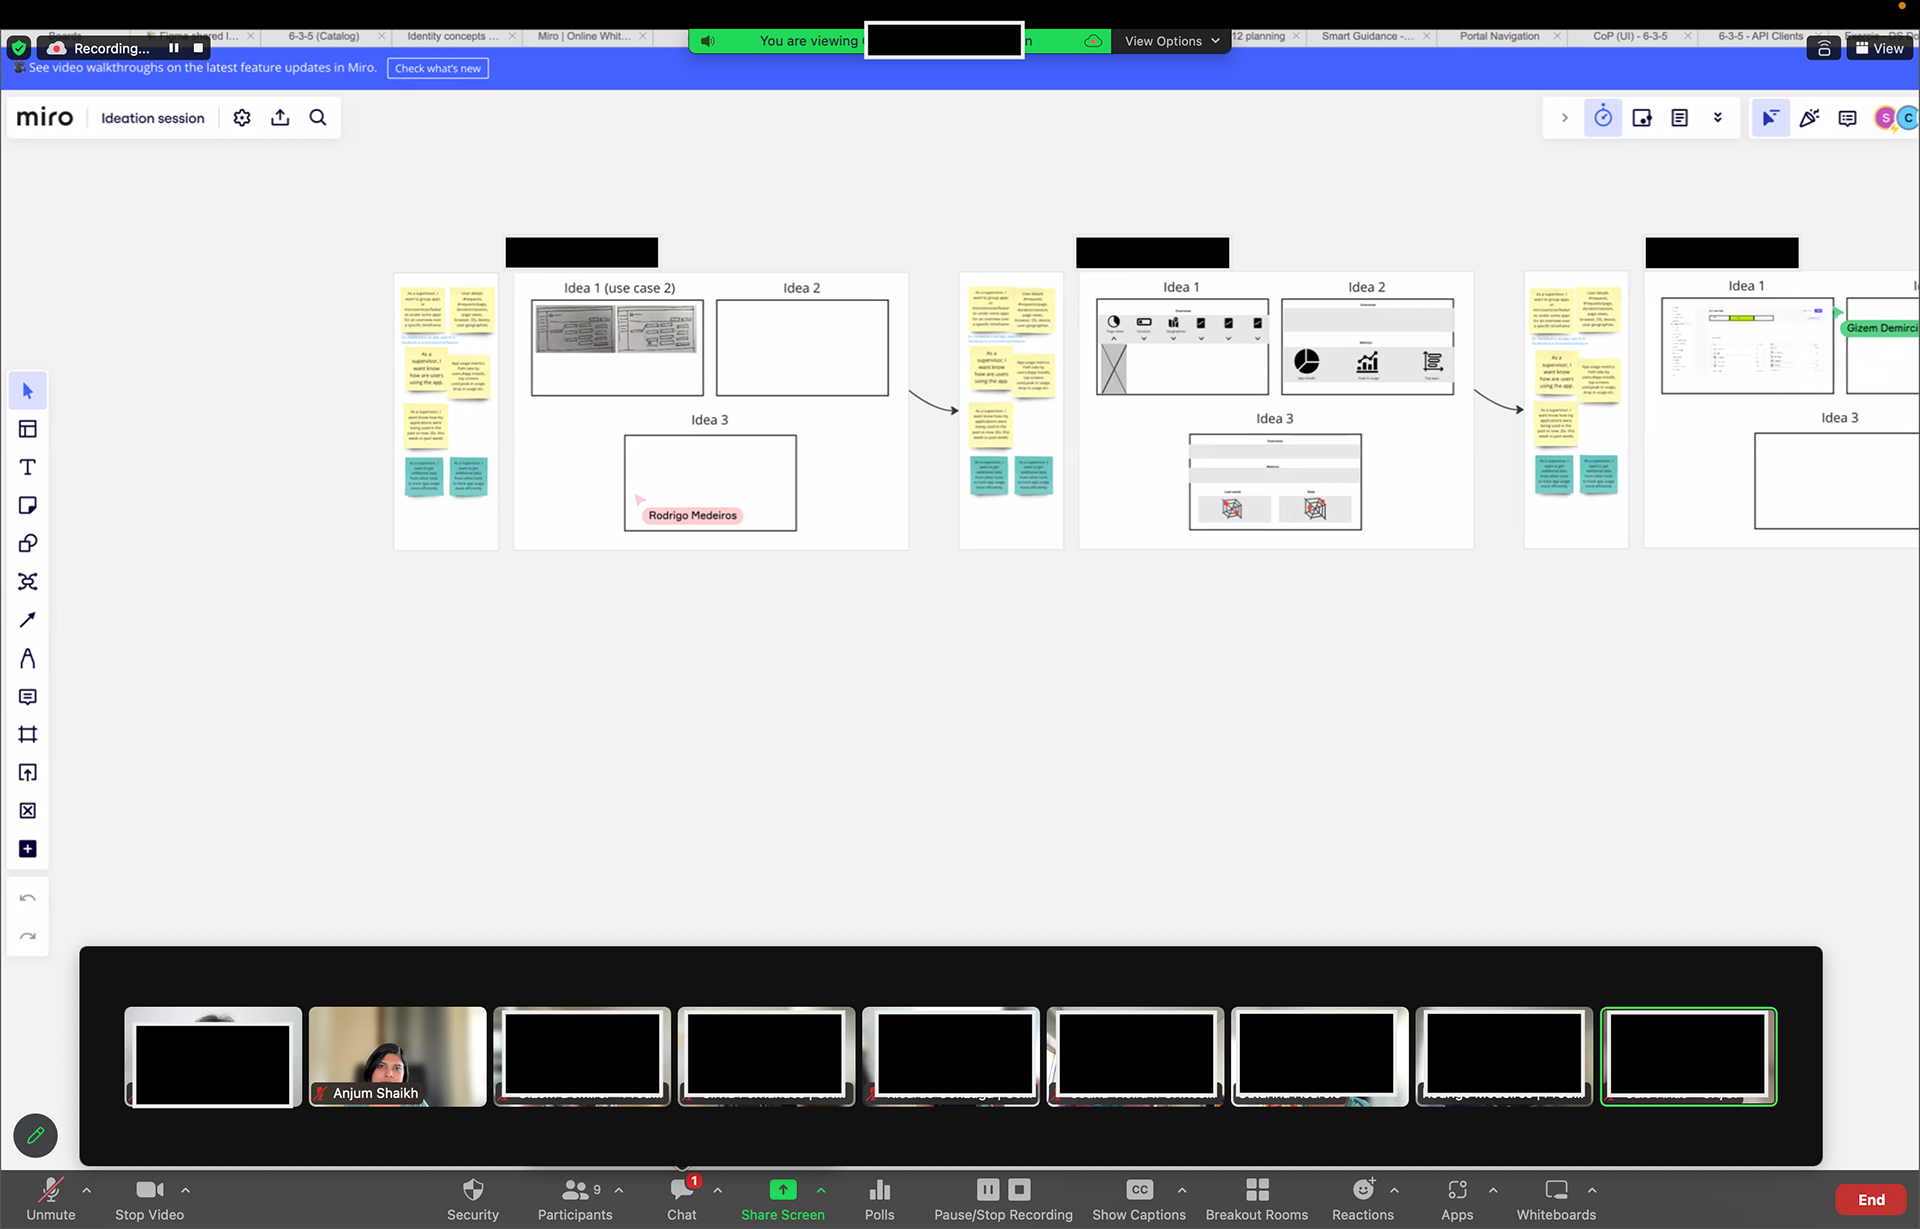
Once the use cases were prepared, the subsequent phase of the design cycle commenced. To initiate the process, I opted for an internal ideation session to collect a wide range of ideas. This exercise was conducted using the 6-3-5 method, which helped in gathering a multitude of diverse ideas. Participants included engineering managers,. product & visual designers and content writers.
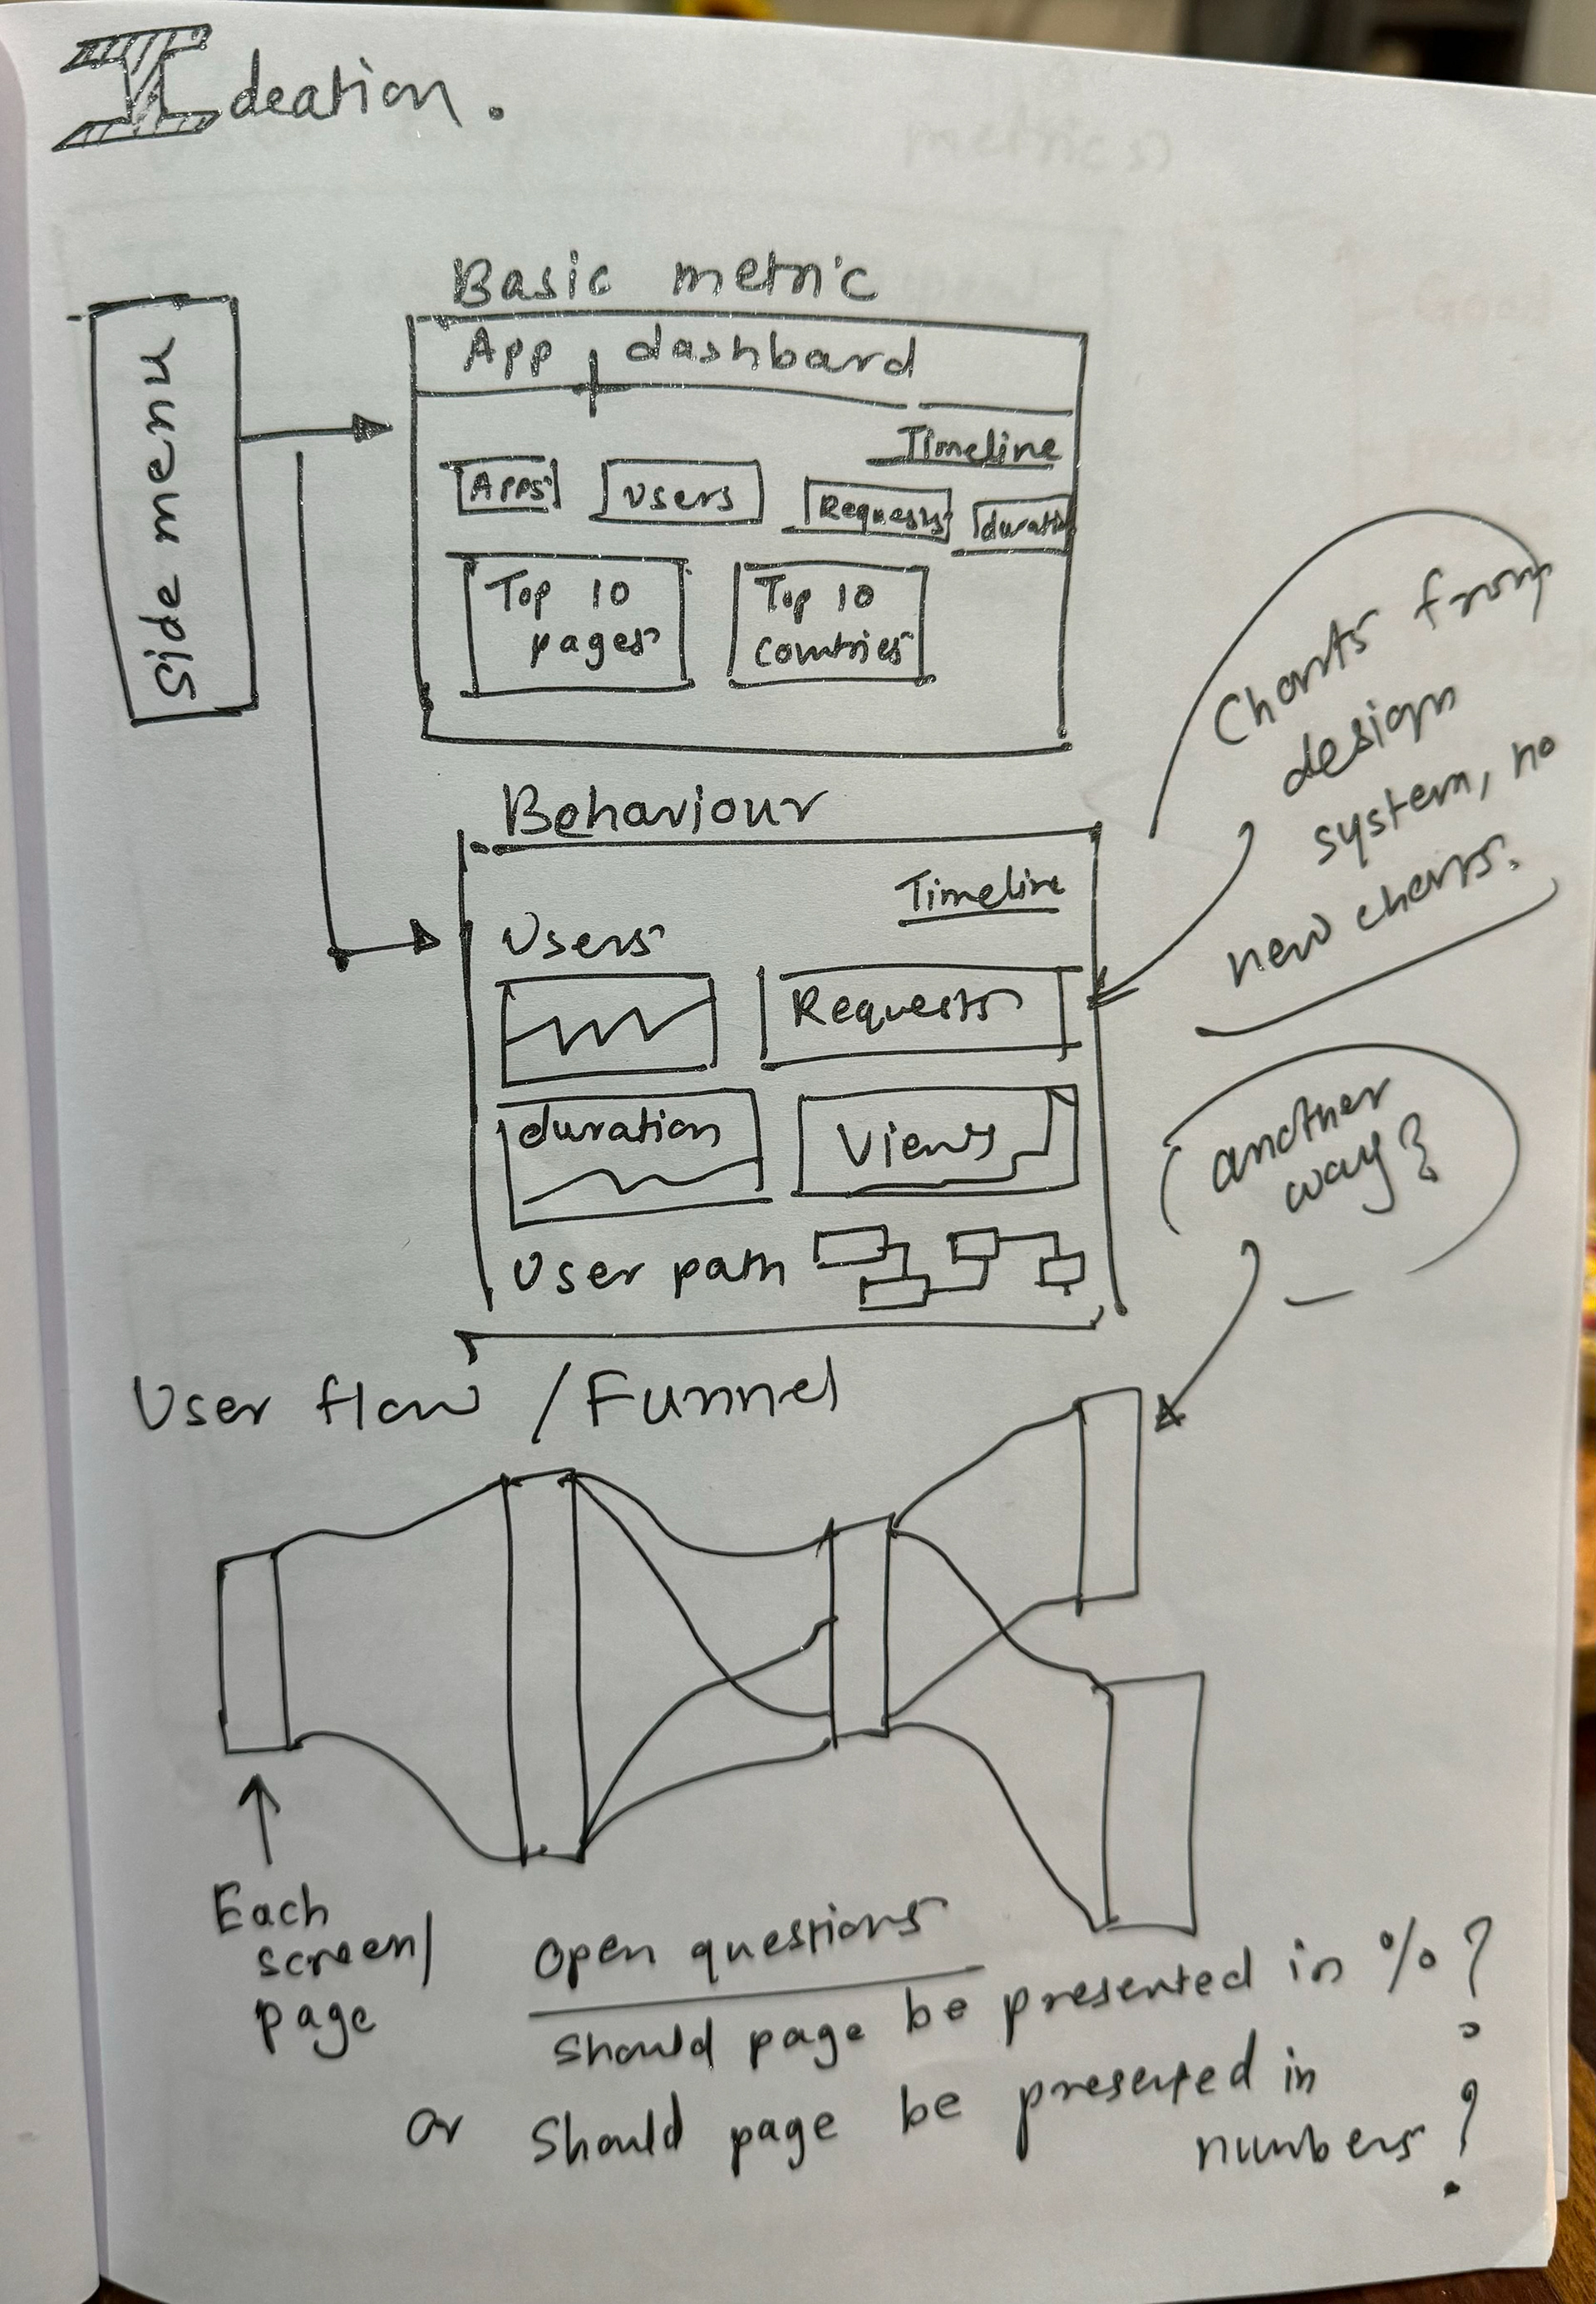
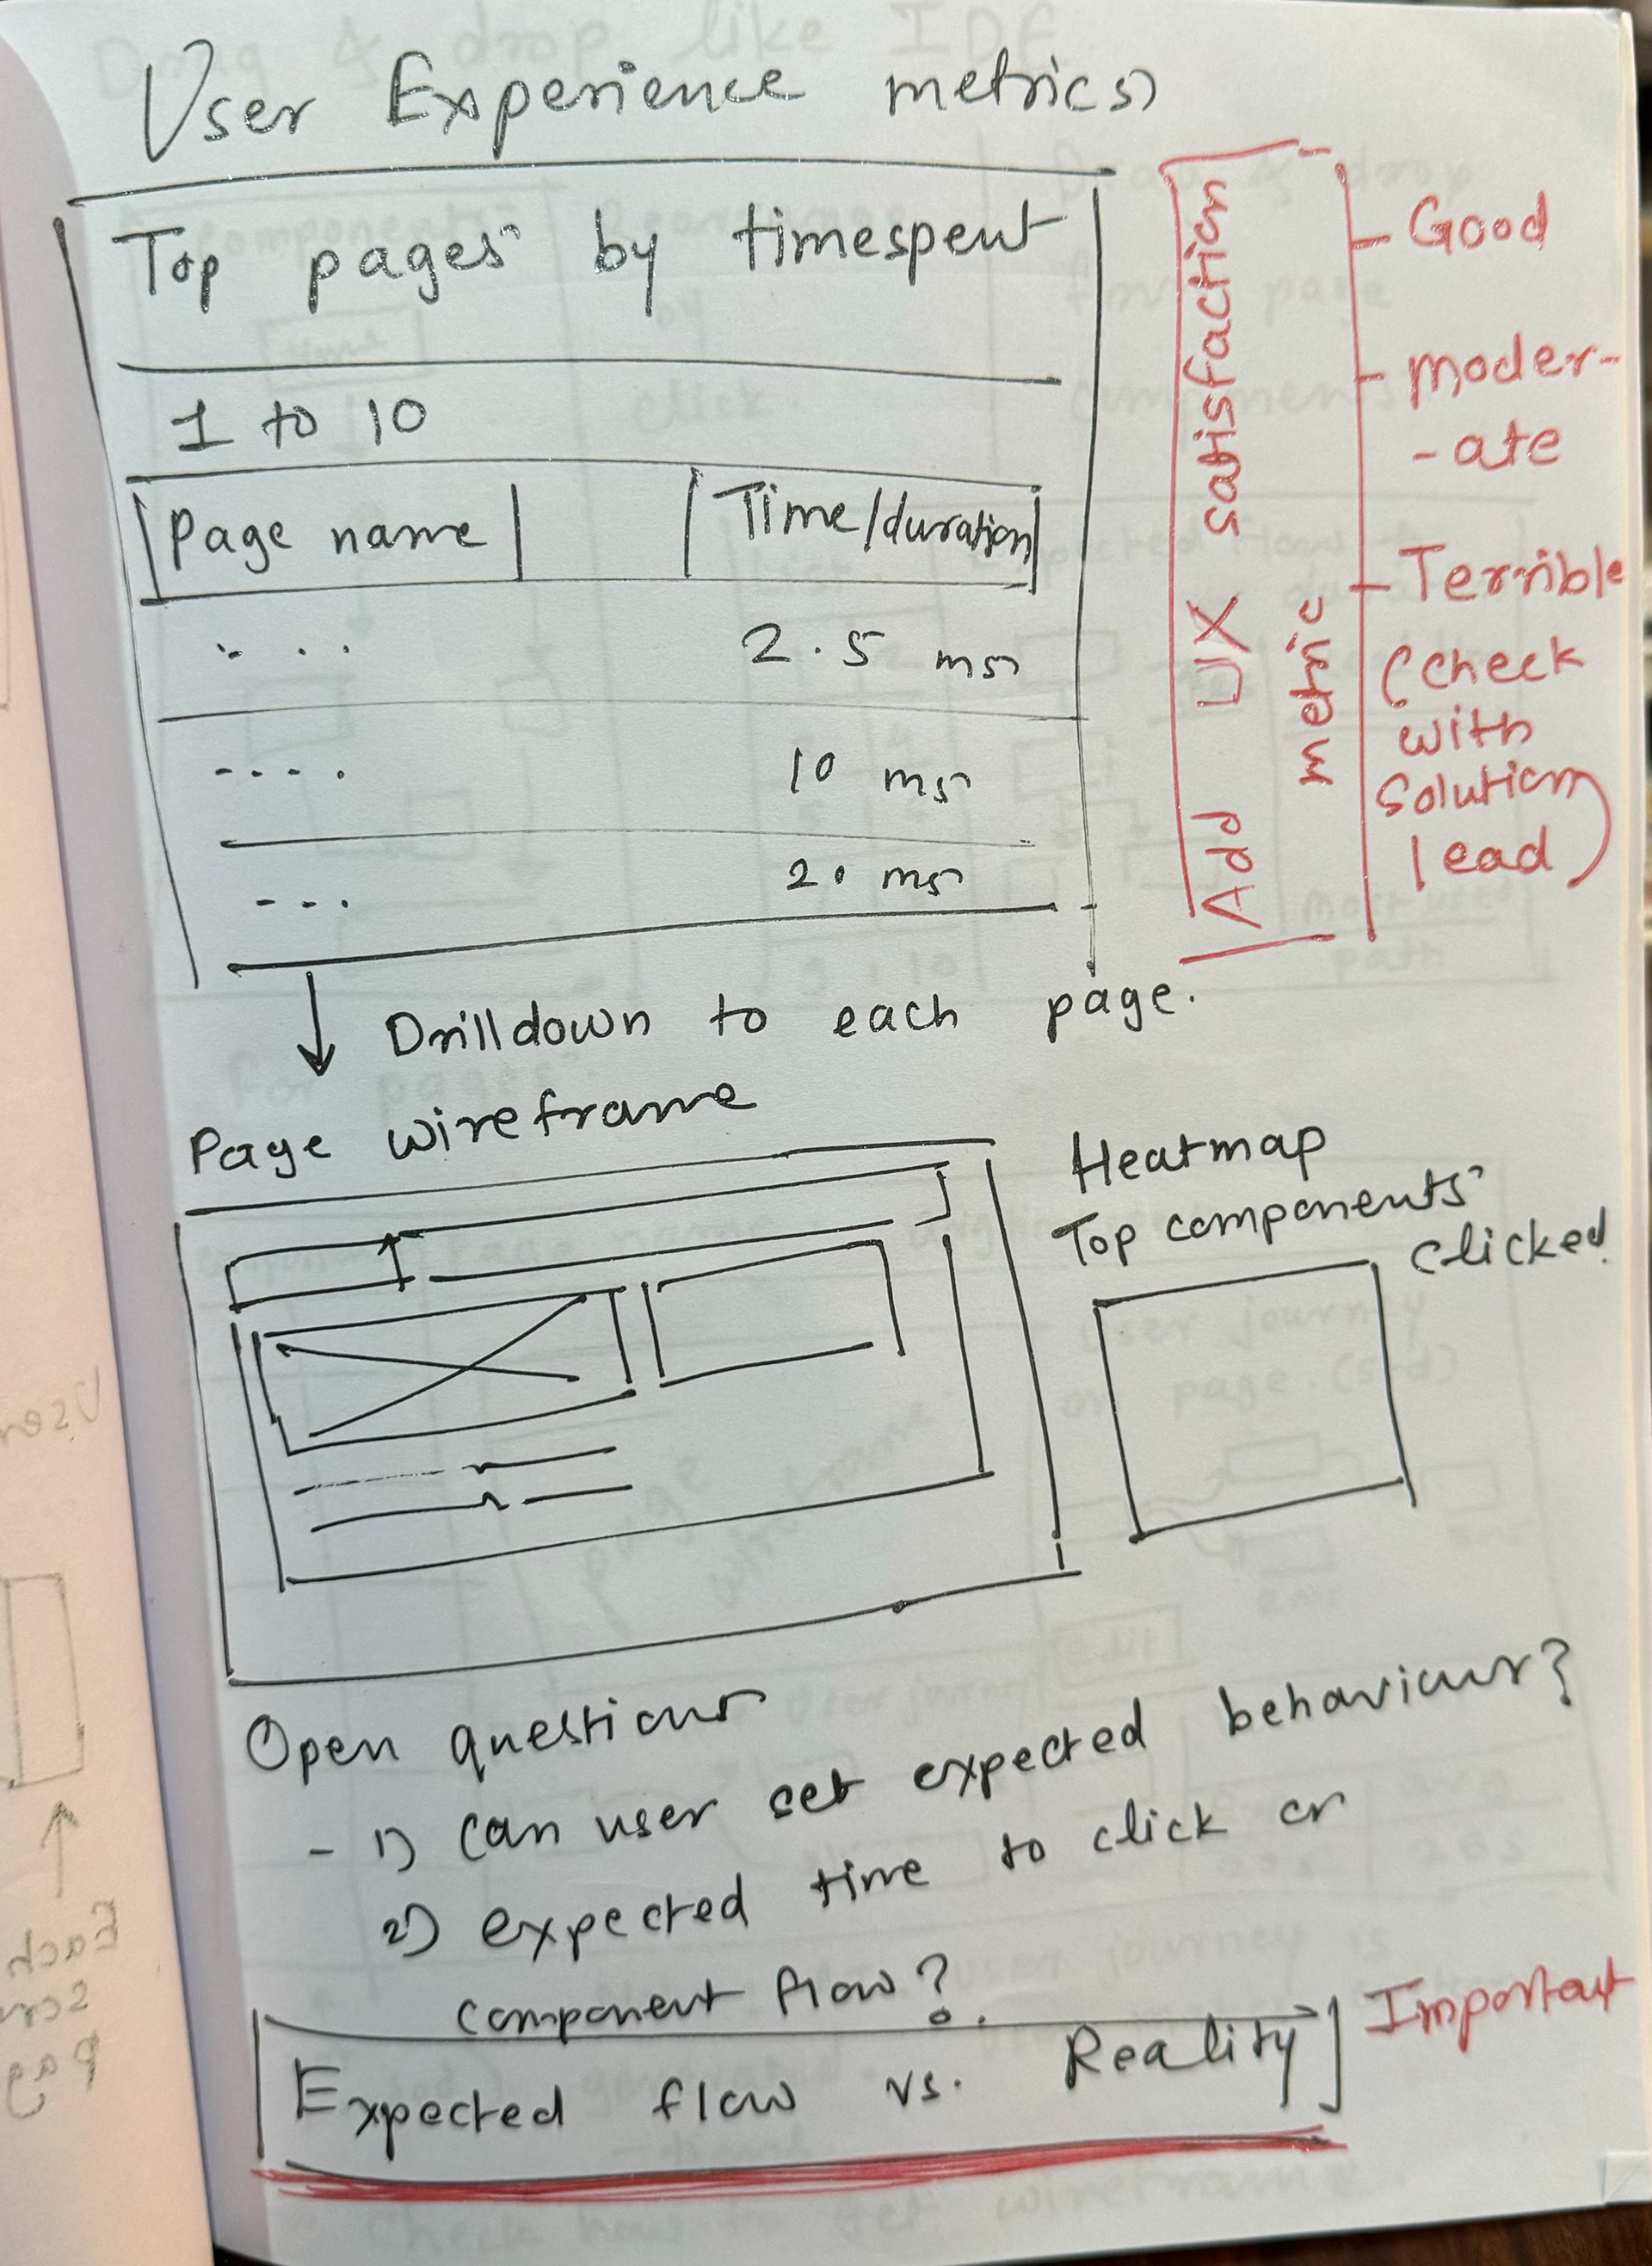
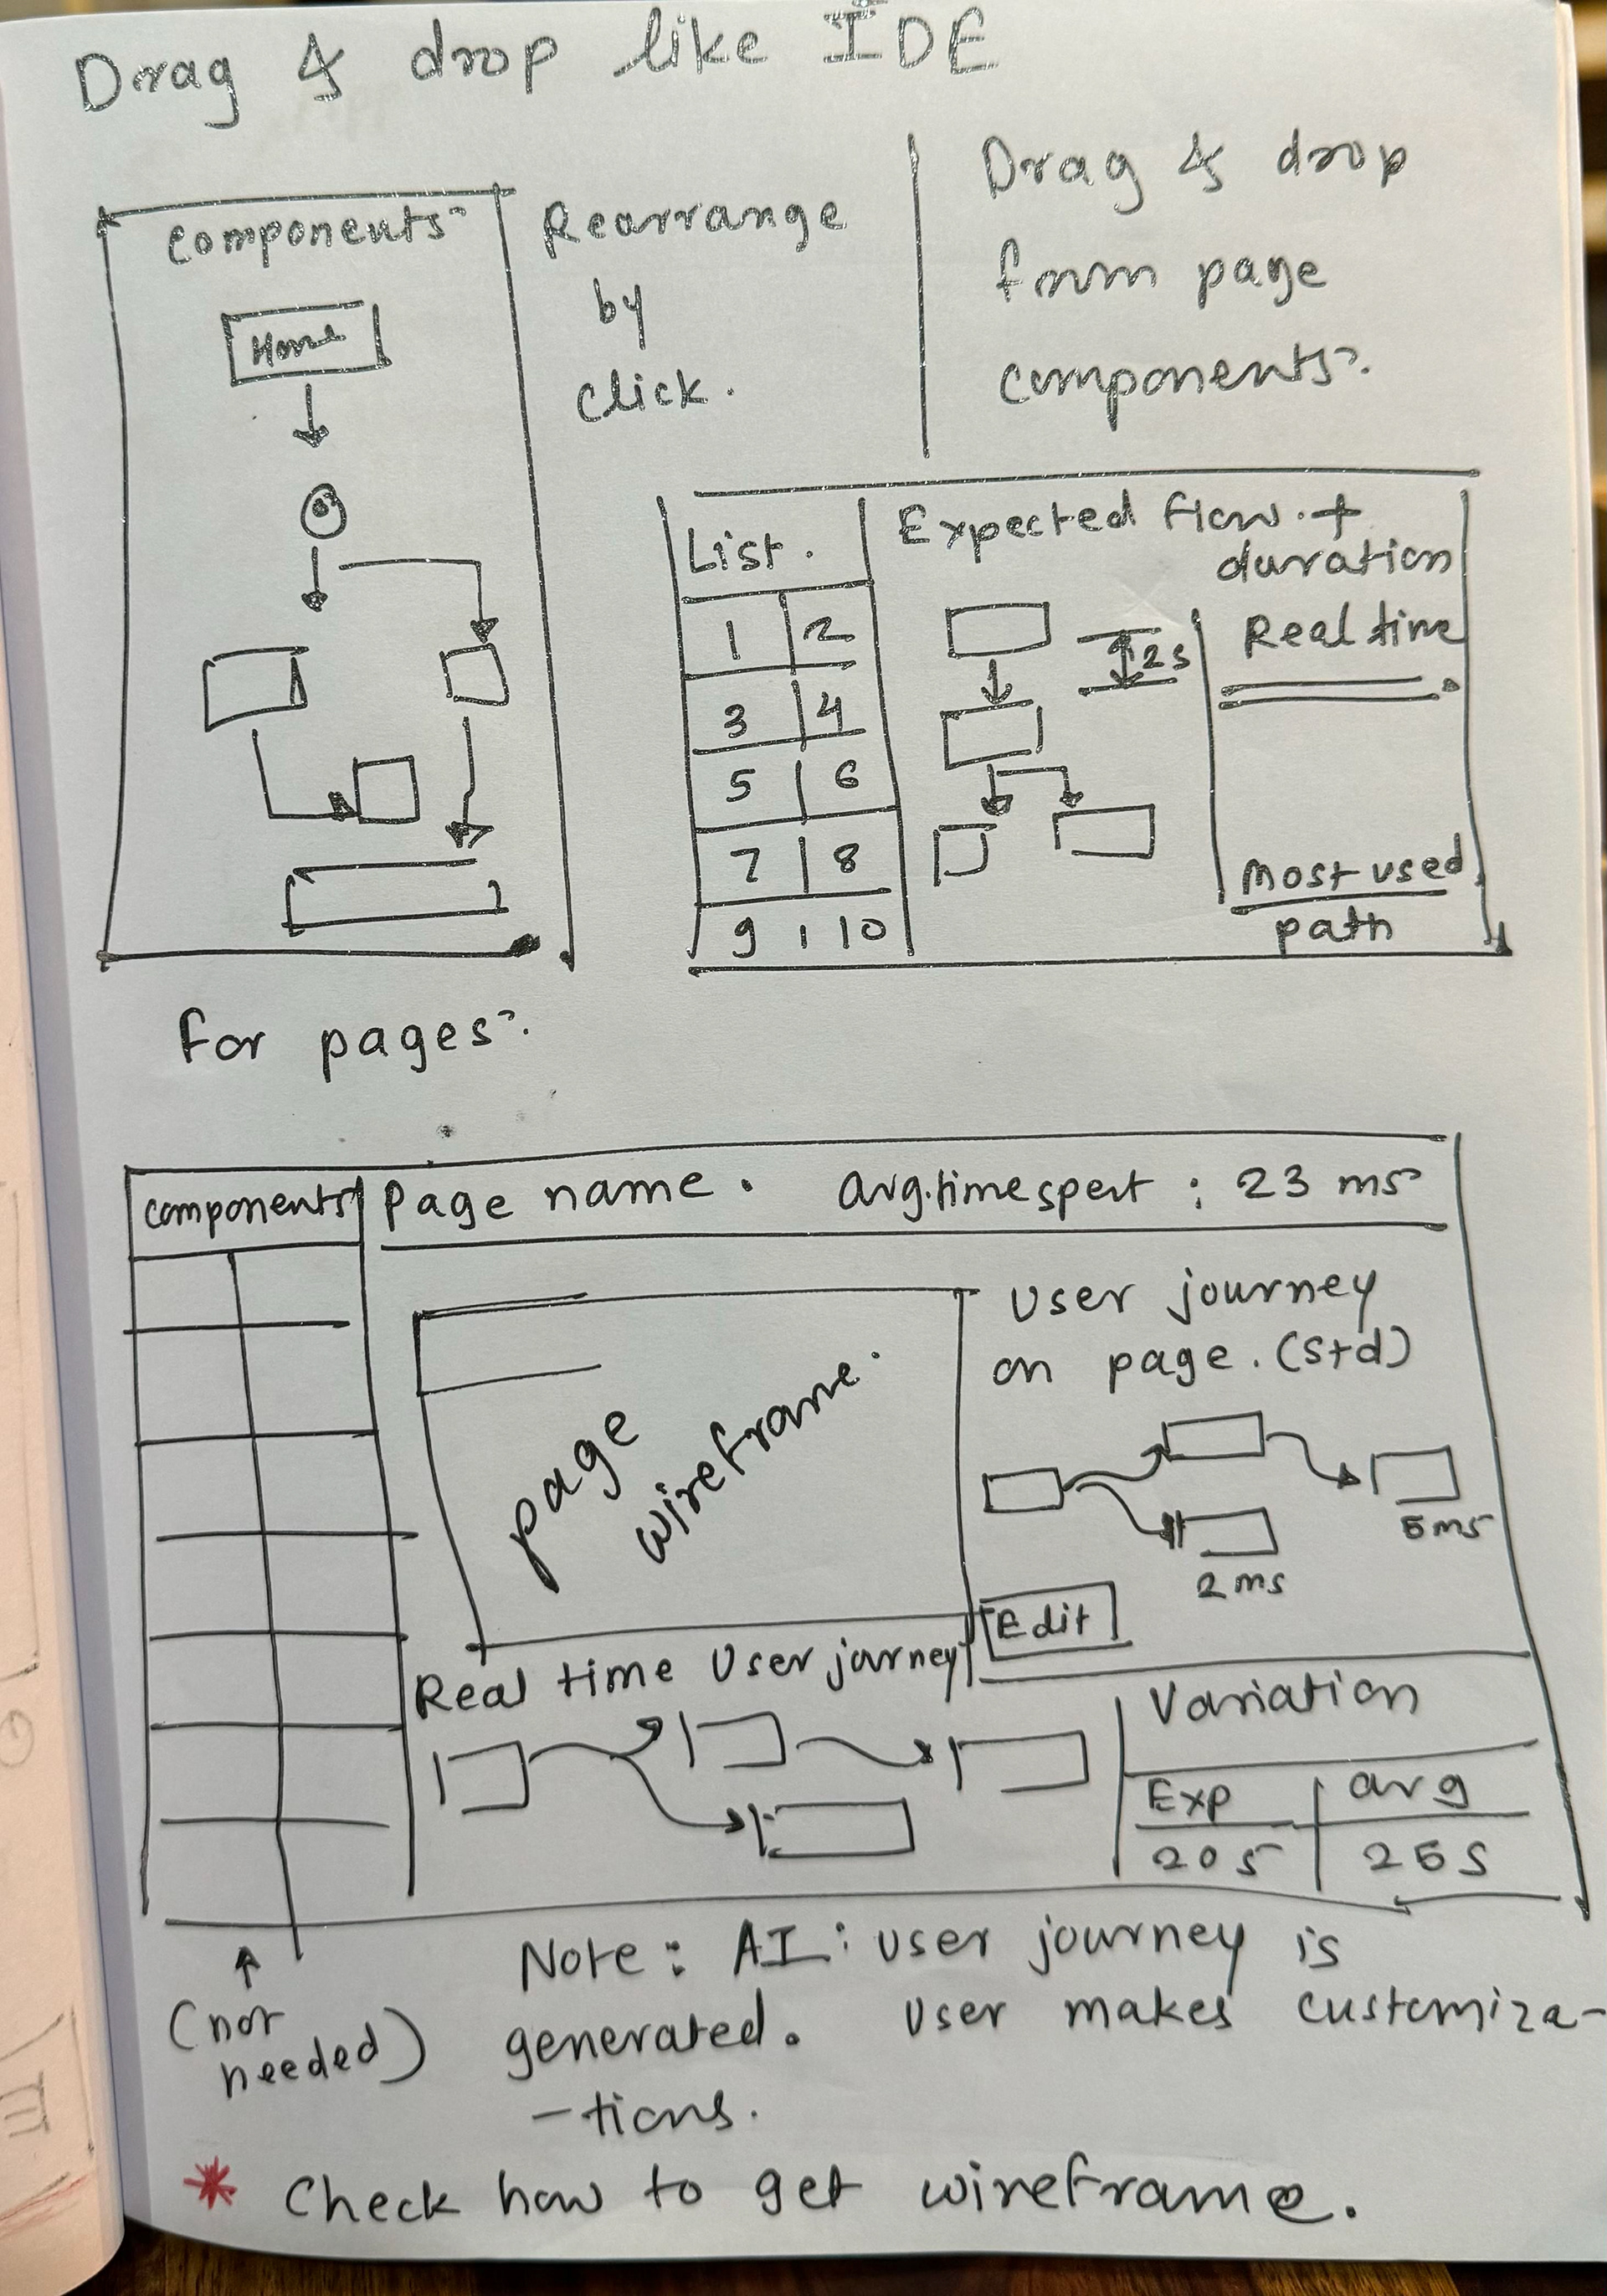
Rough ideas & user journey ideation
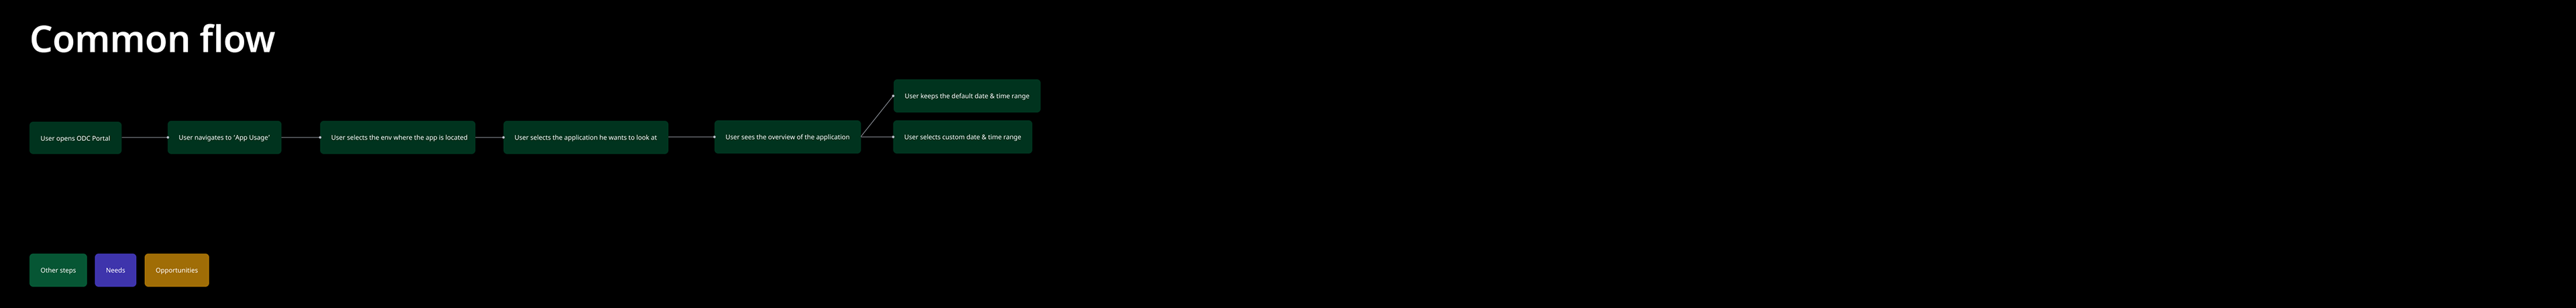
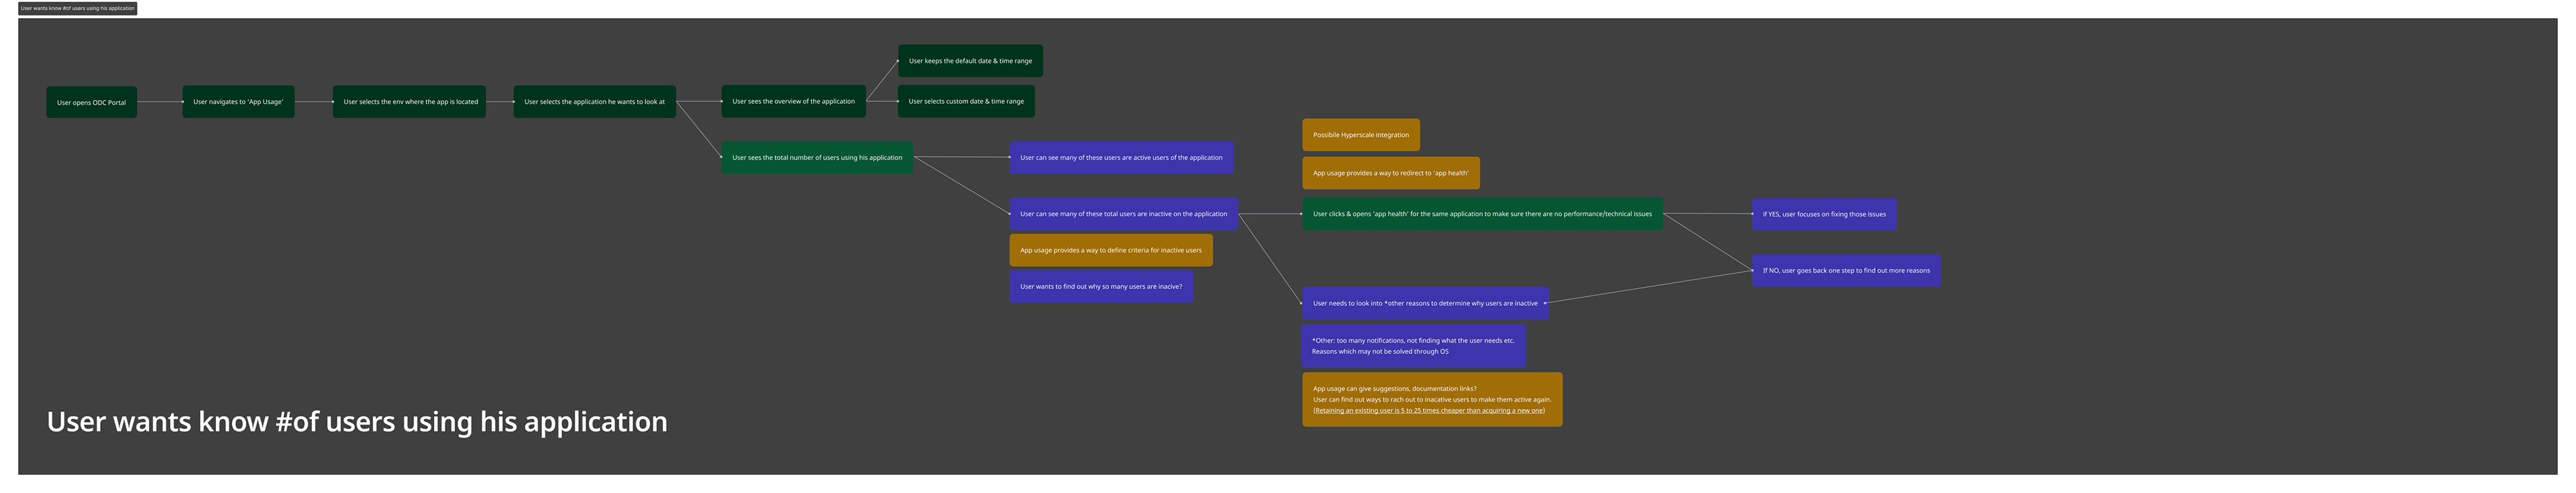
Ideating user journeys
Ideating user journeys
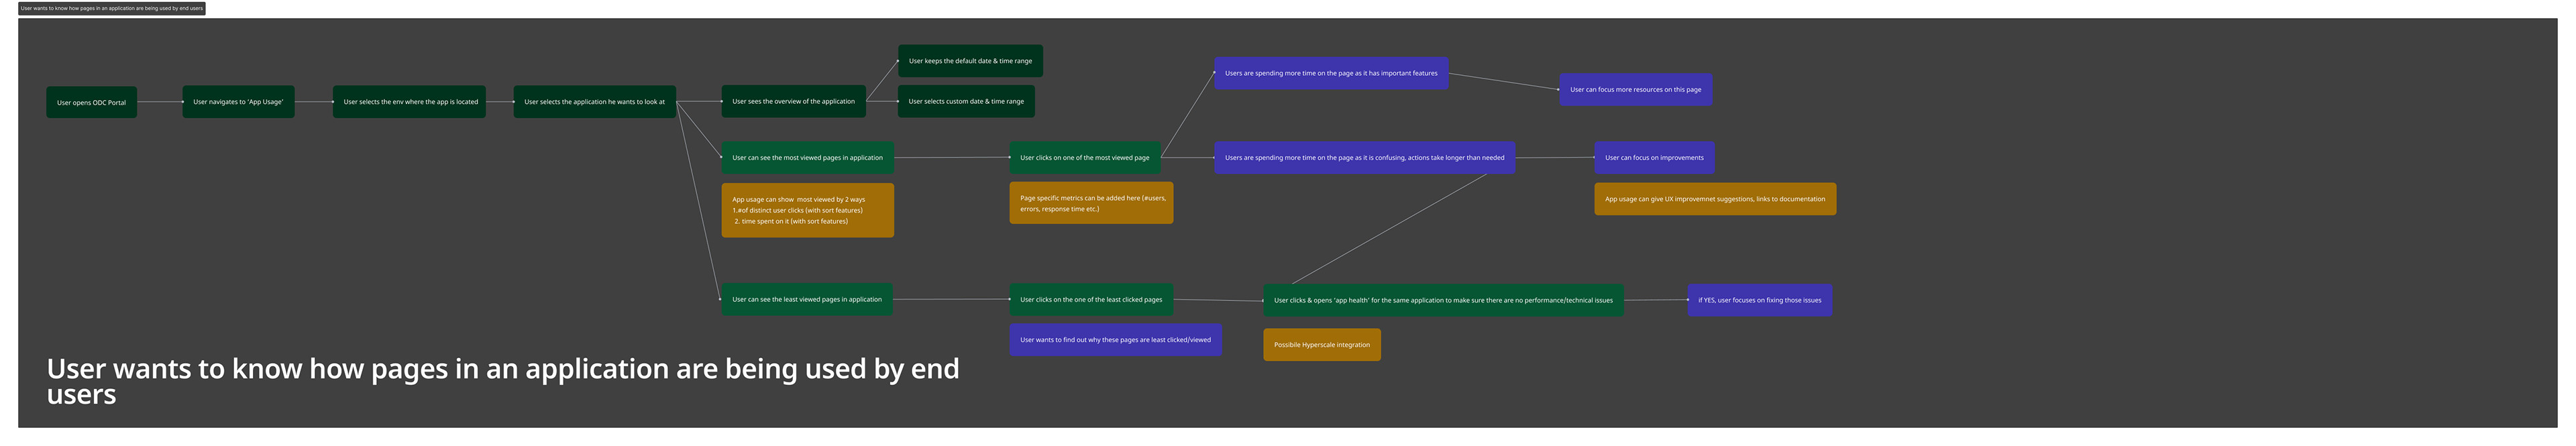
Ideating user journeys
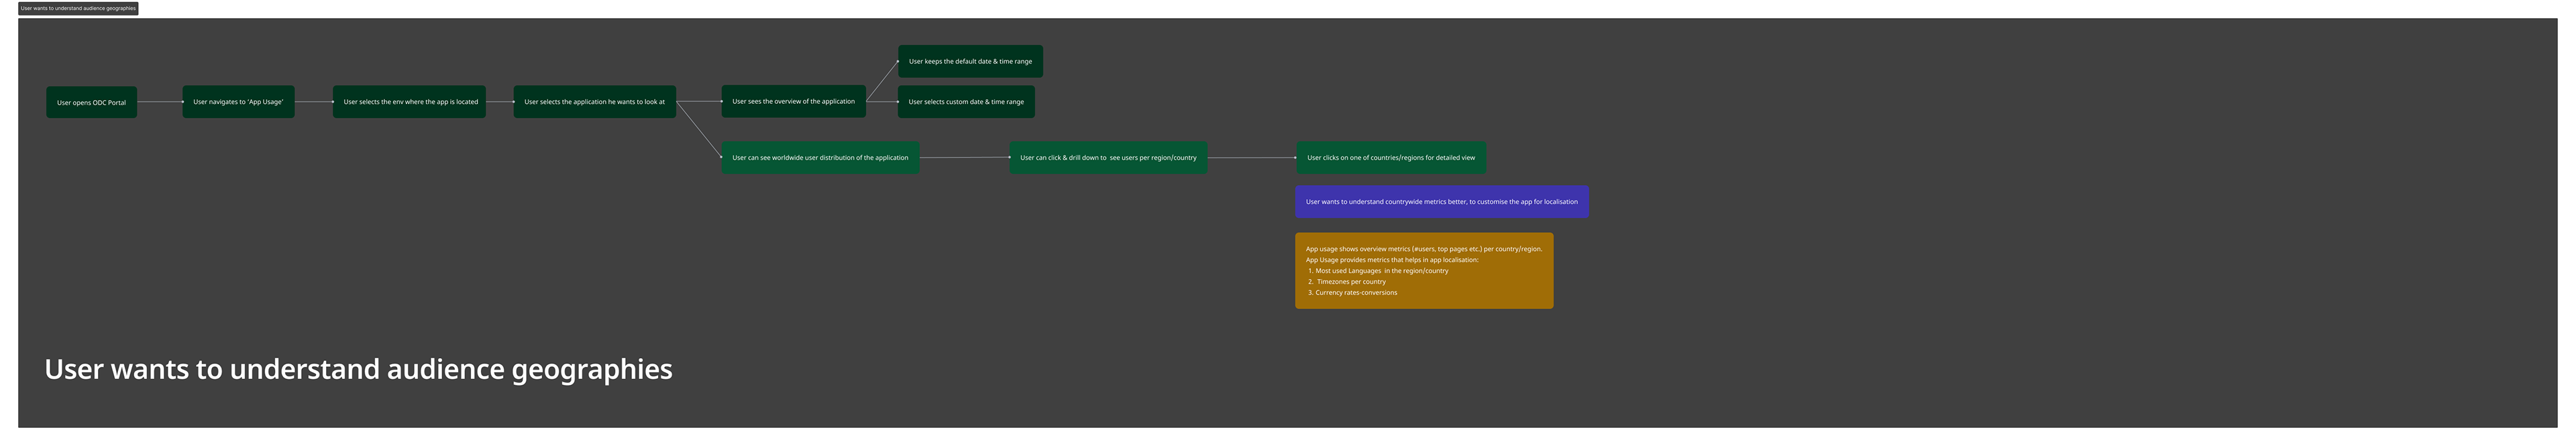
Ideating user journeys
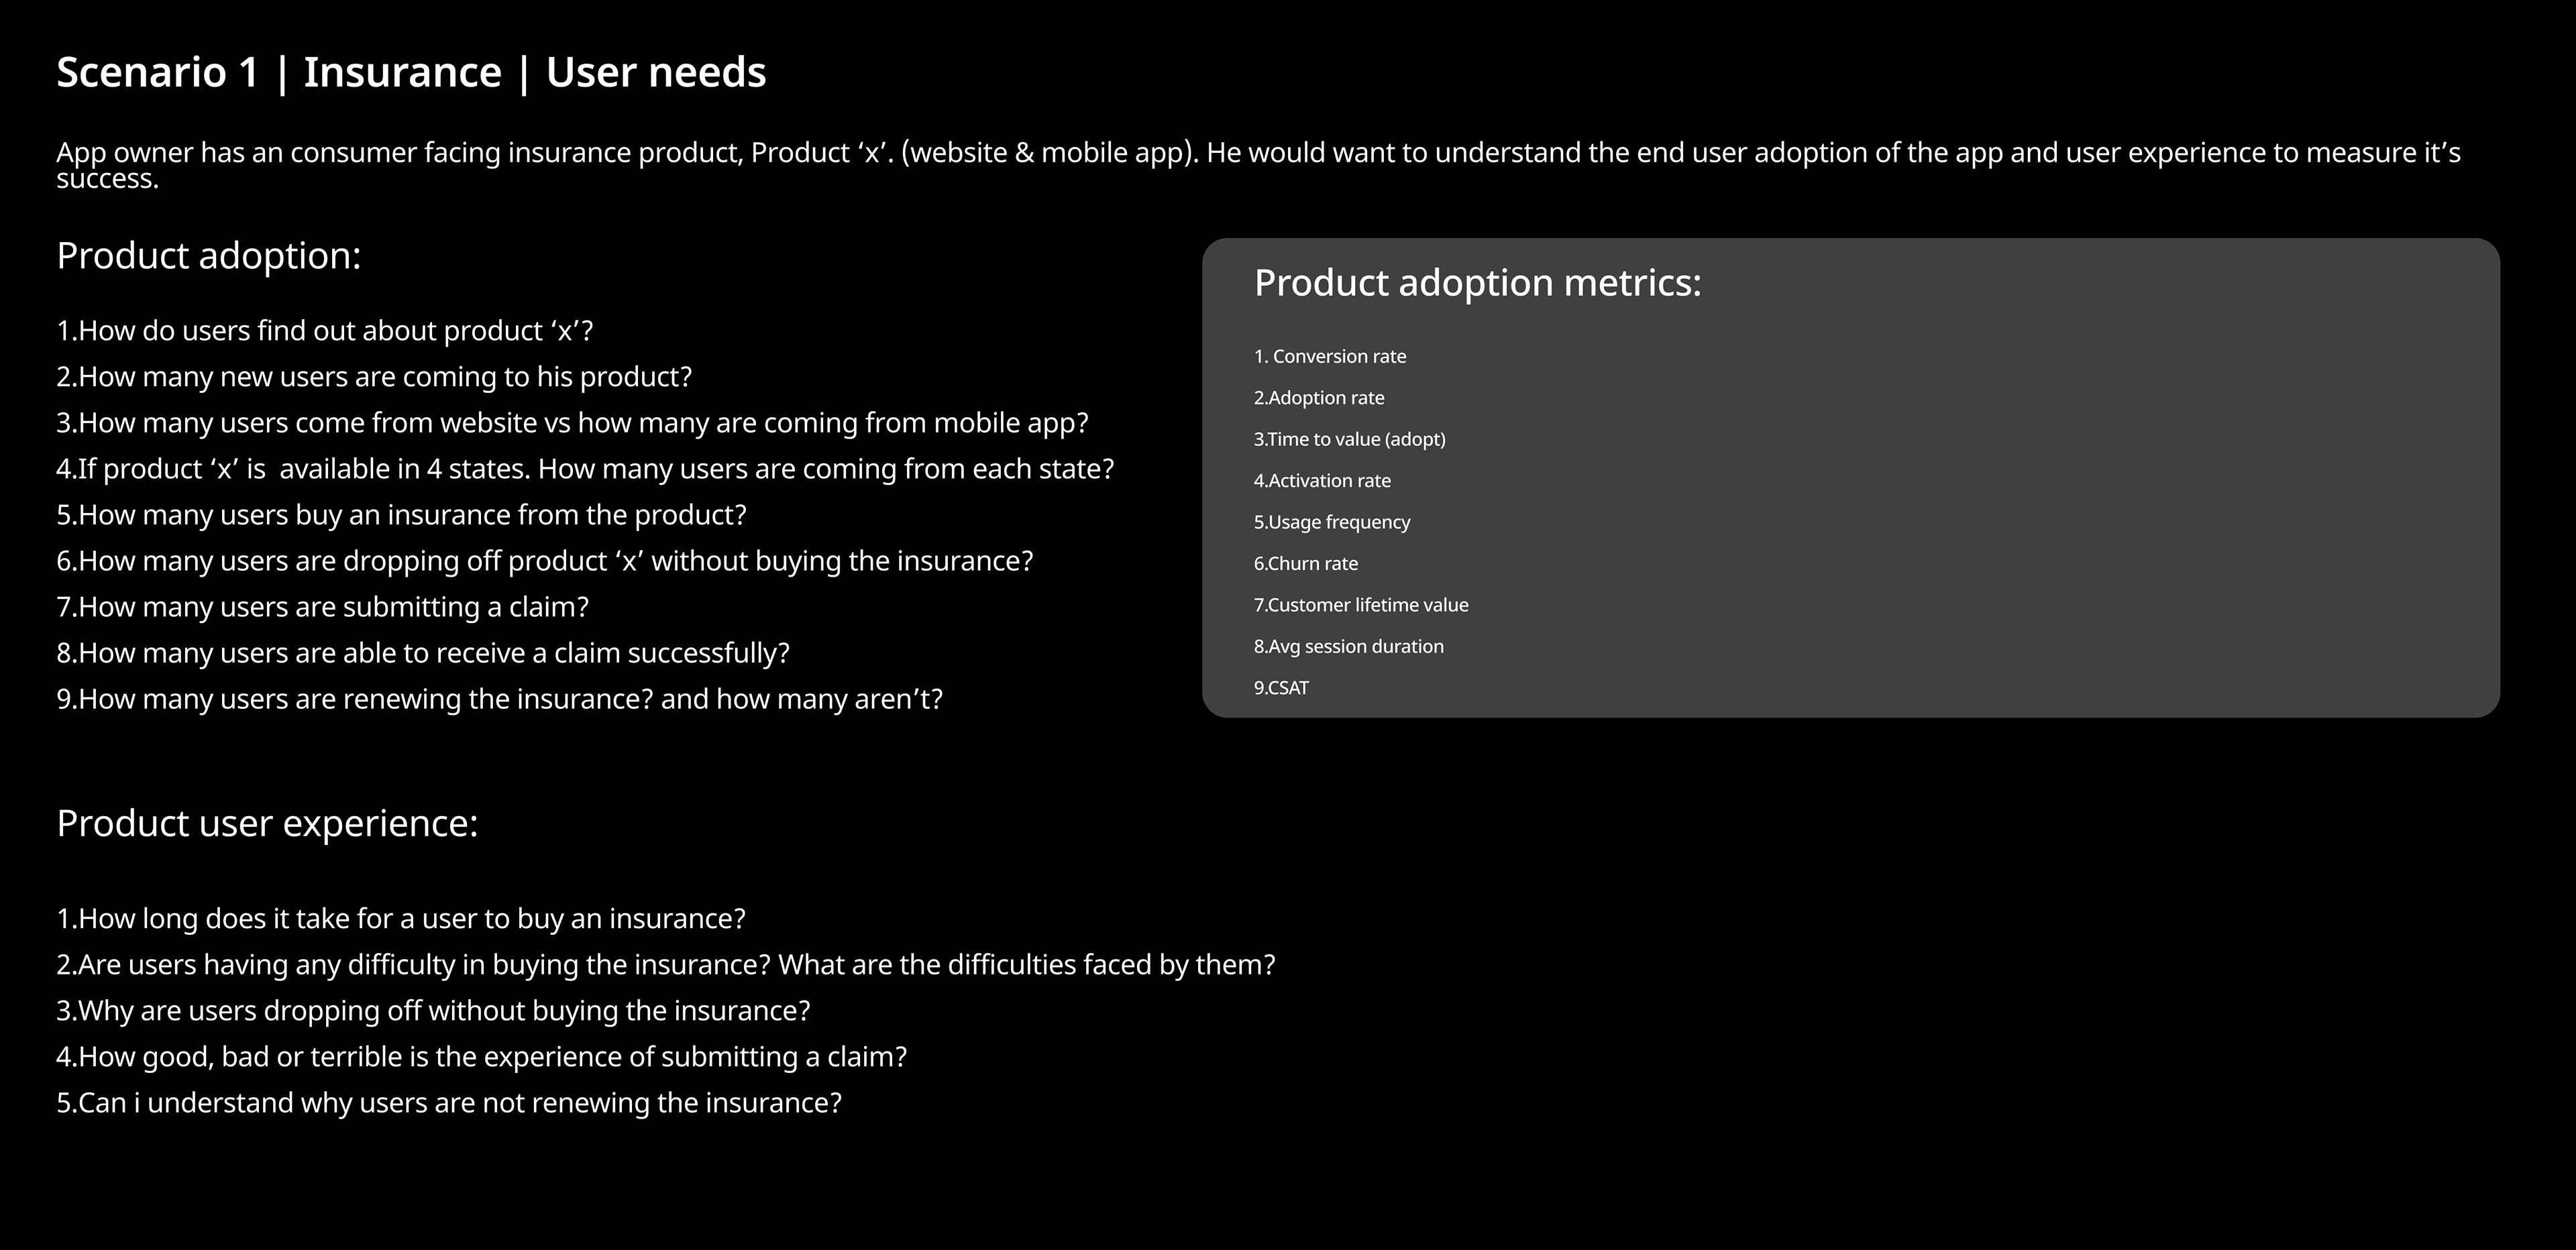
Detailed user journey with a sample domain
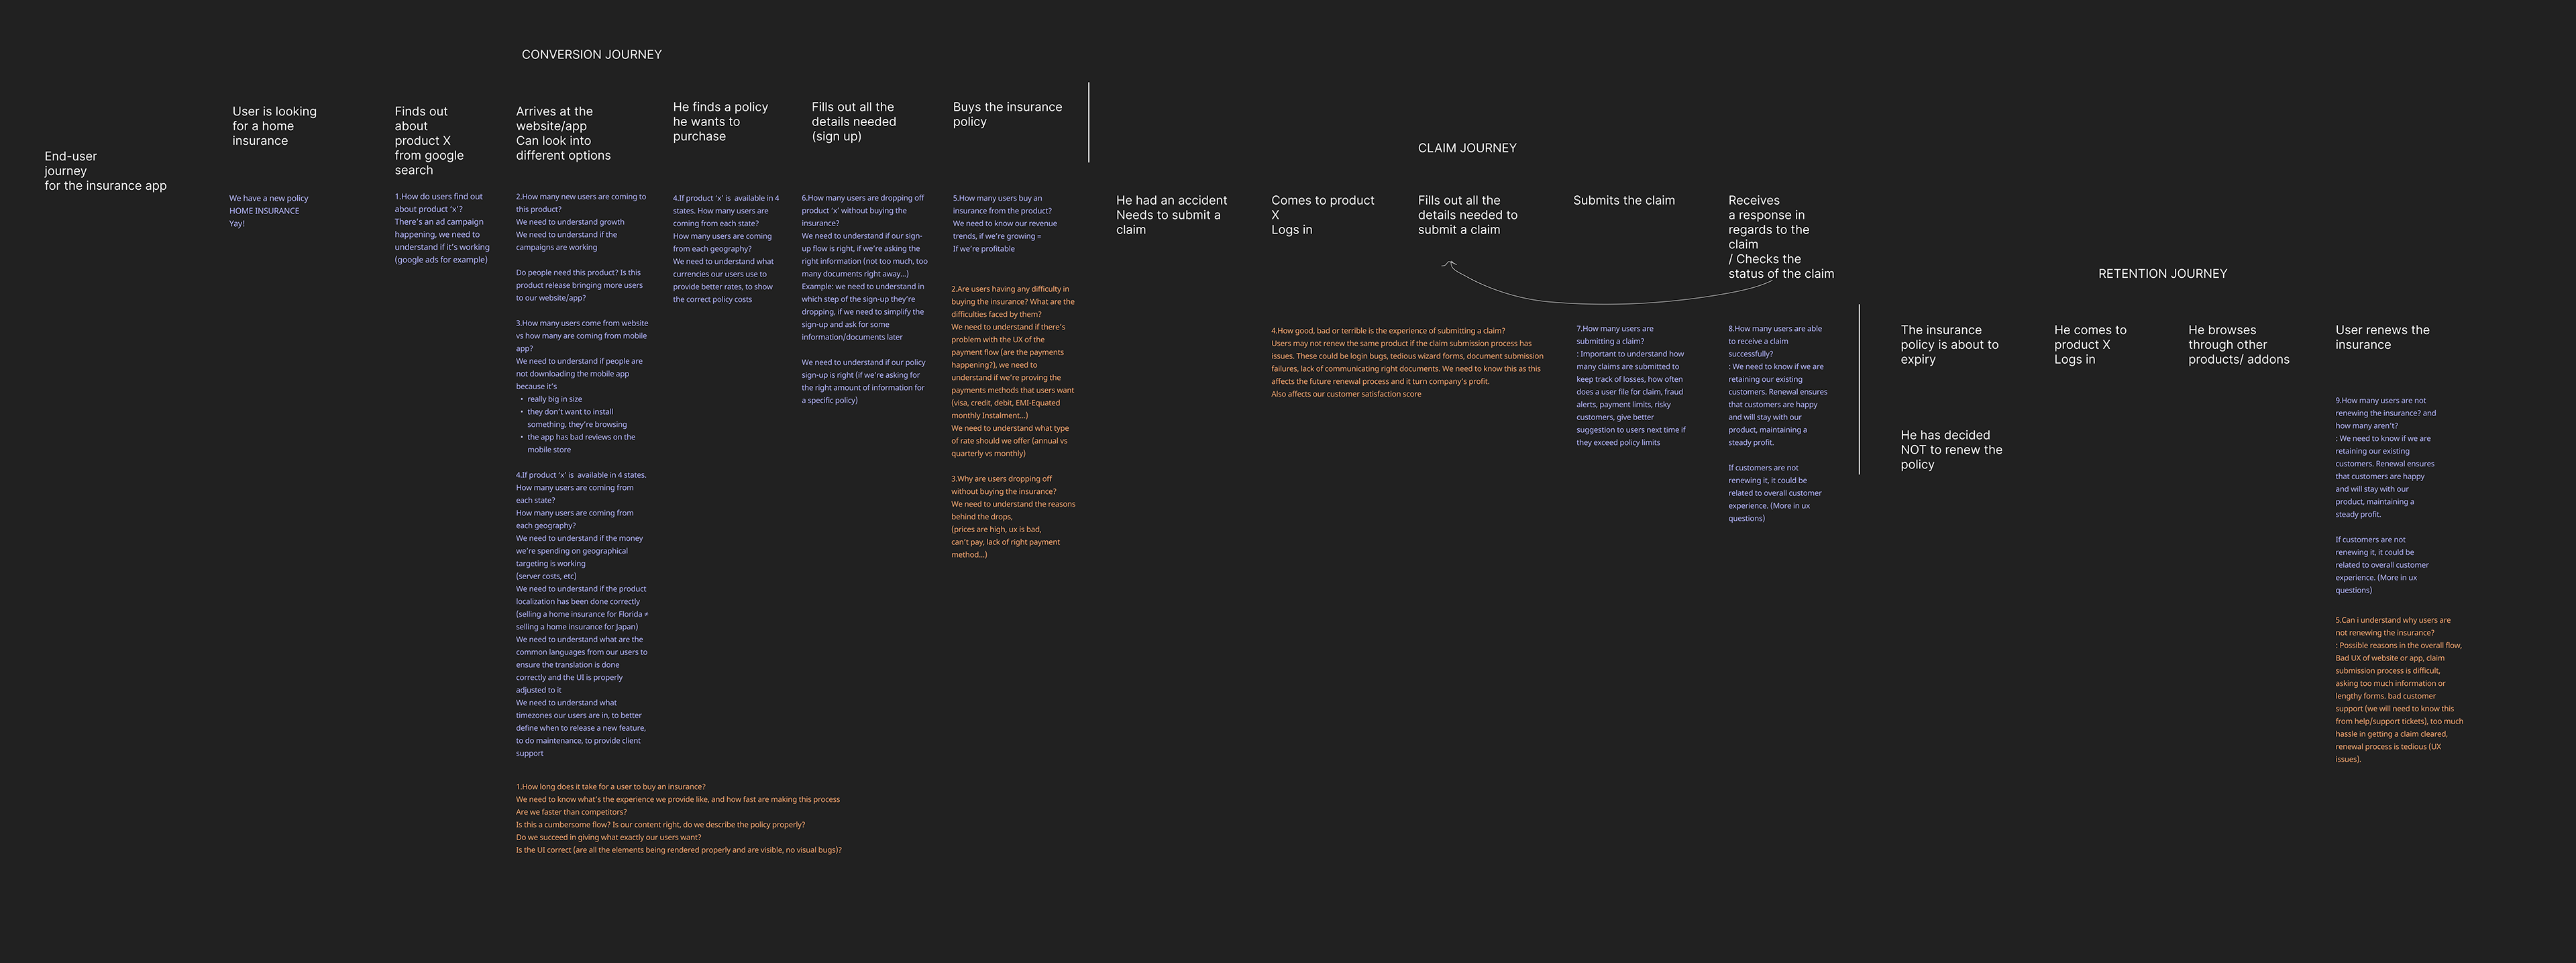
Detailed user jounery with a sample domain (Insurance)
Solution design | Low-fidelity wireframe


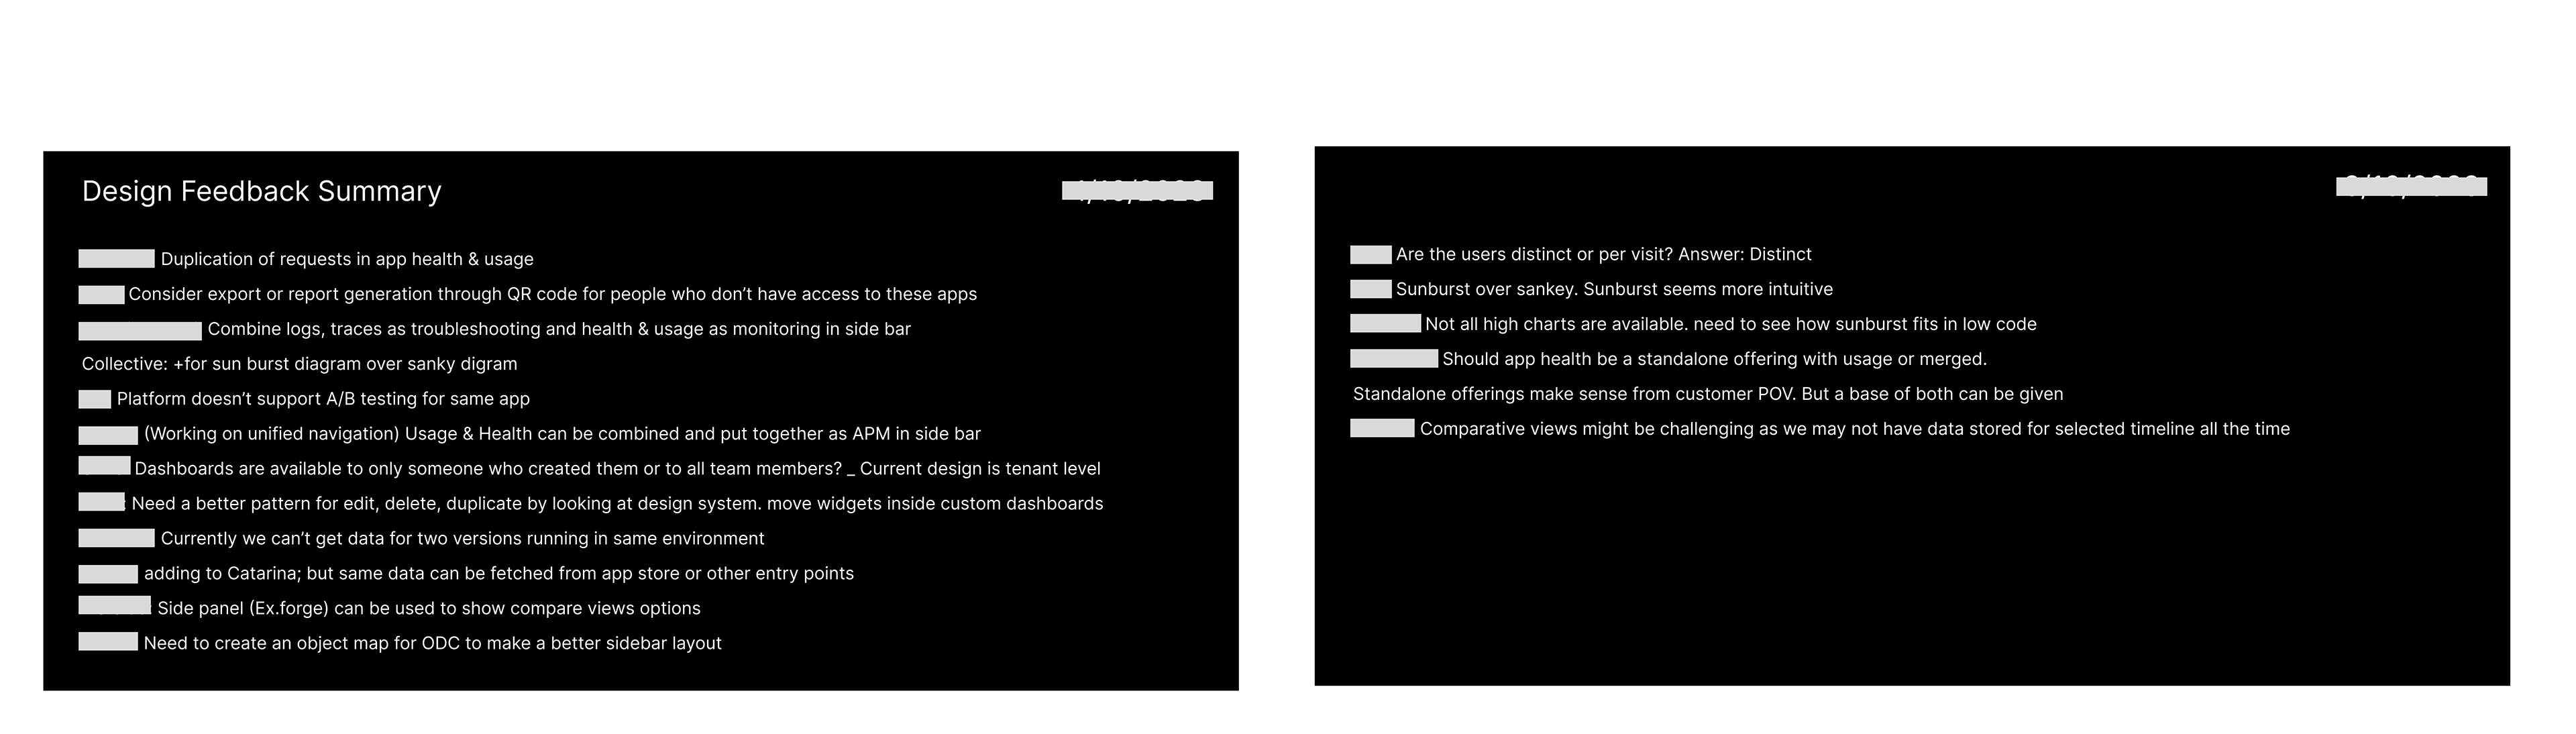
Solution design | Design reviews
Several internal design reviews were conducted with product managers, product designers, the design system team, architects, tech leads, and content writers to ensure that the final designs were practical and met all use cases.
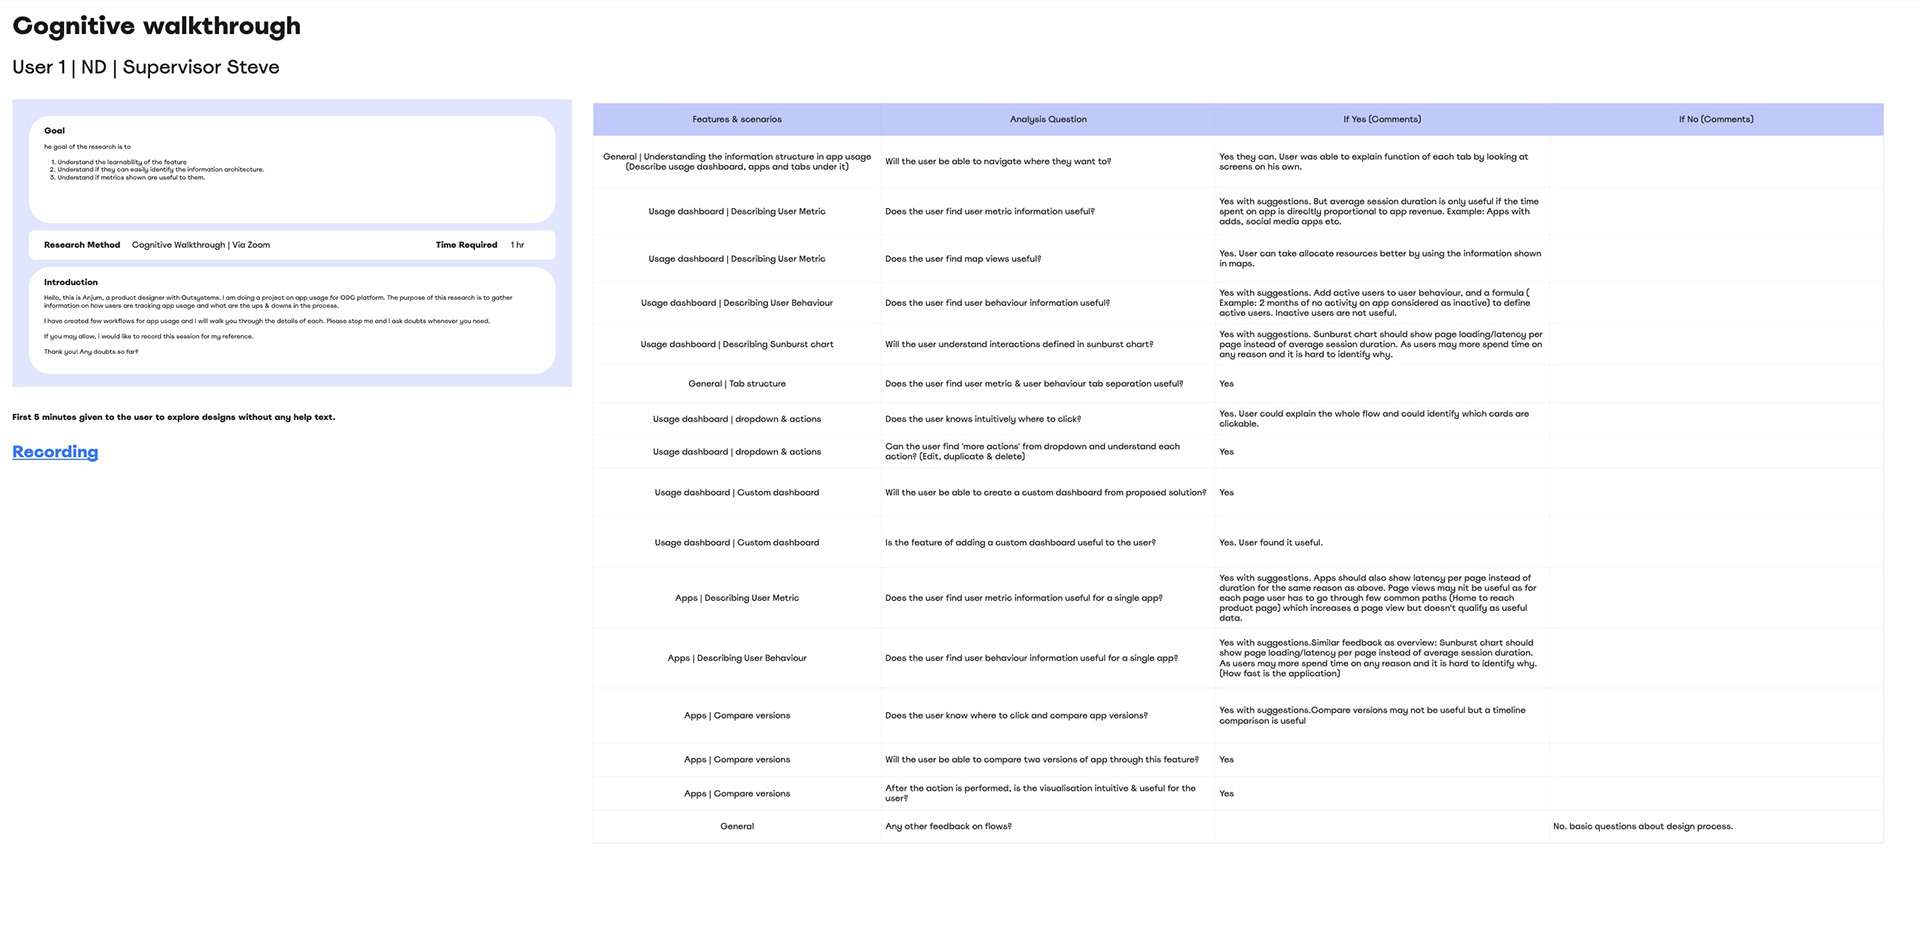
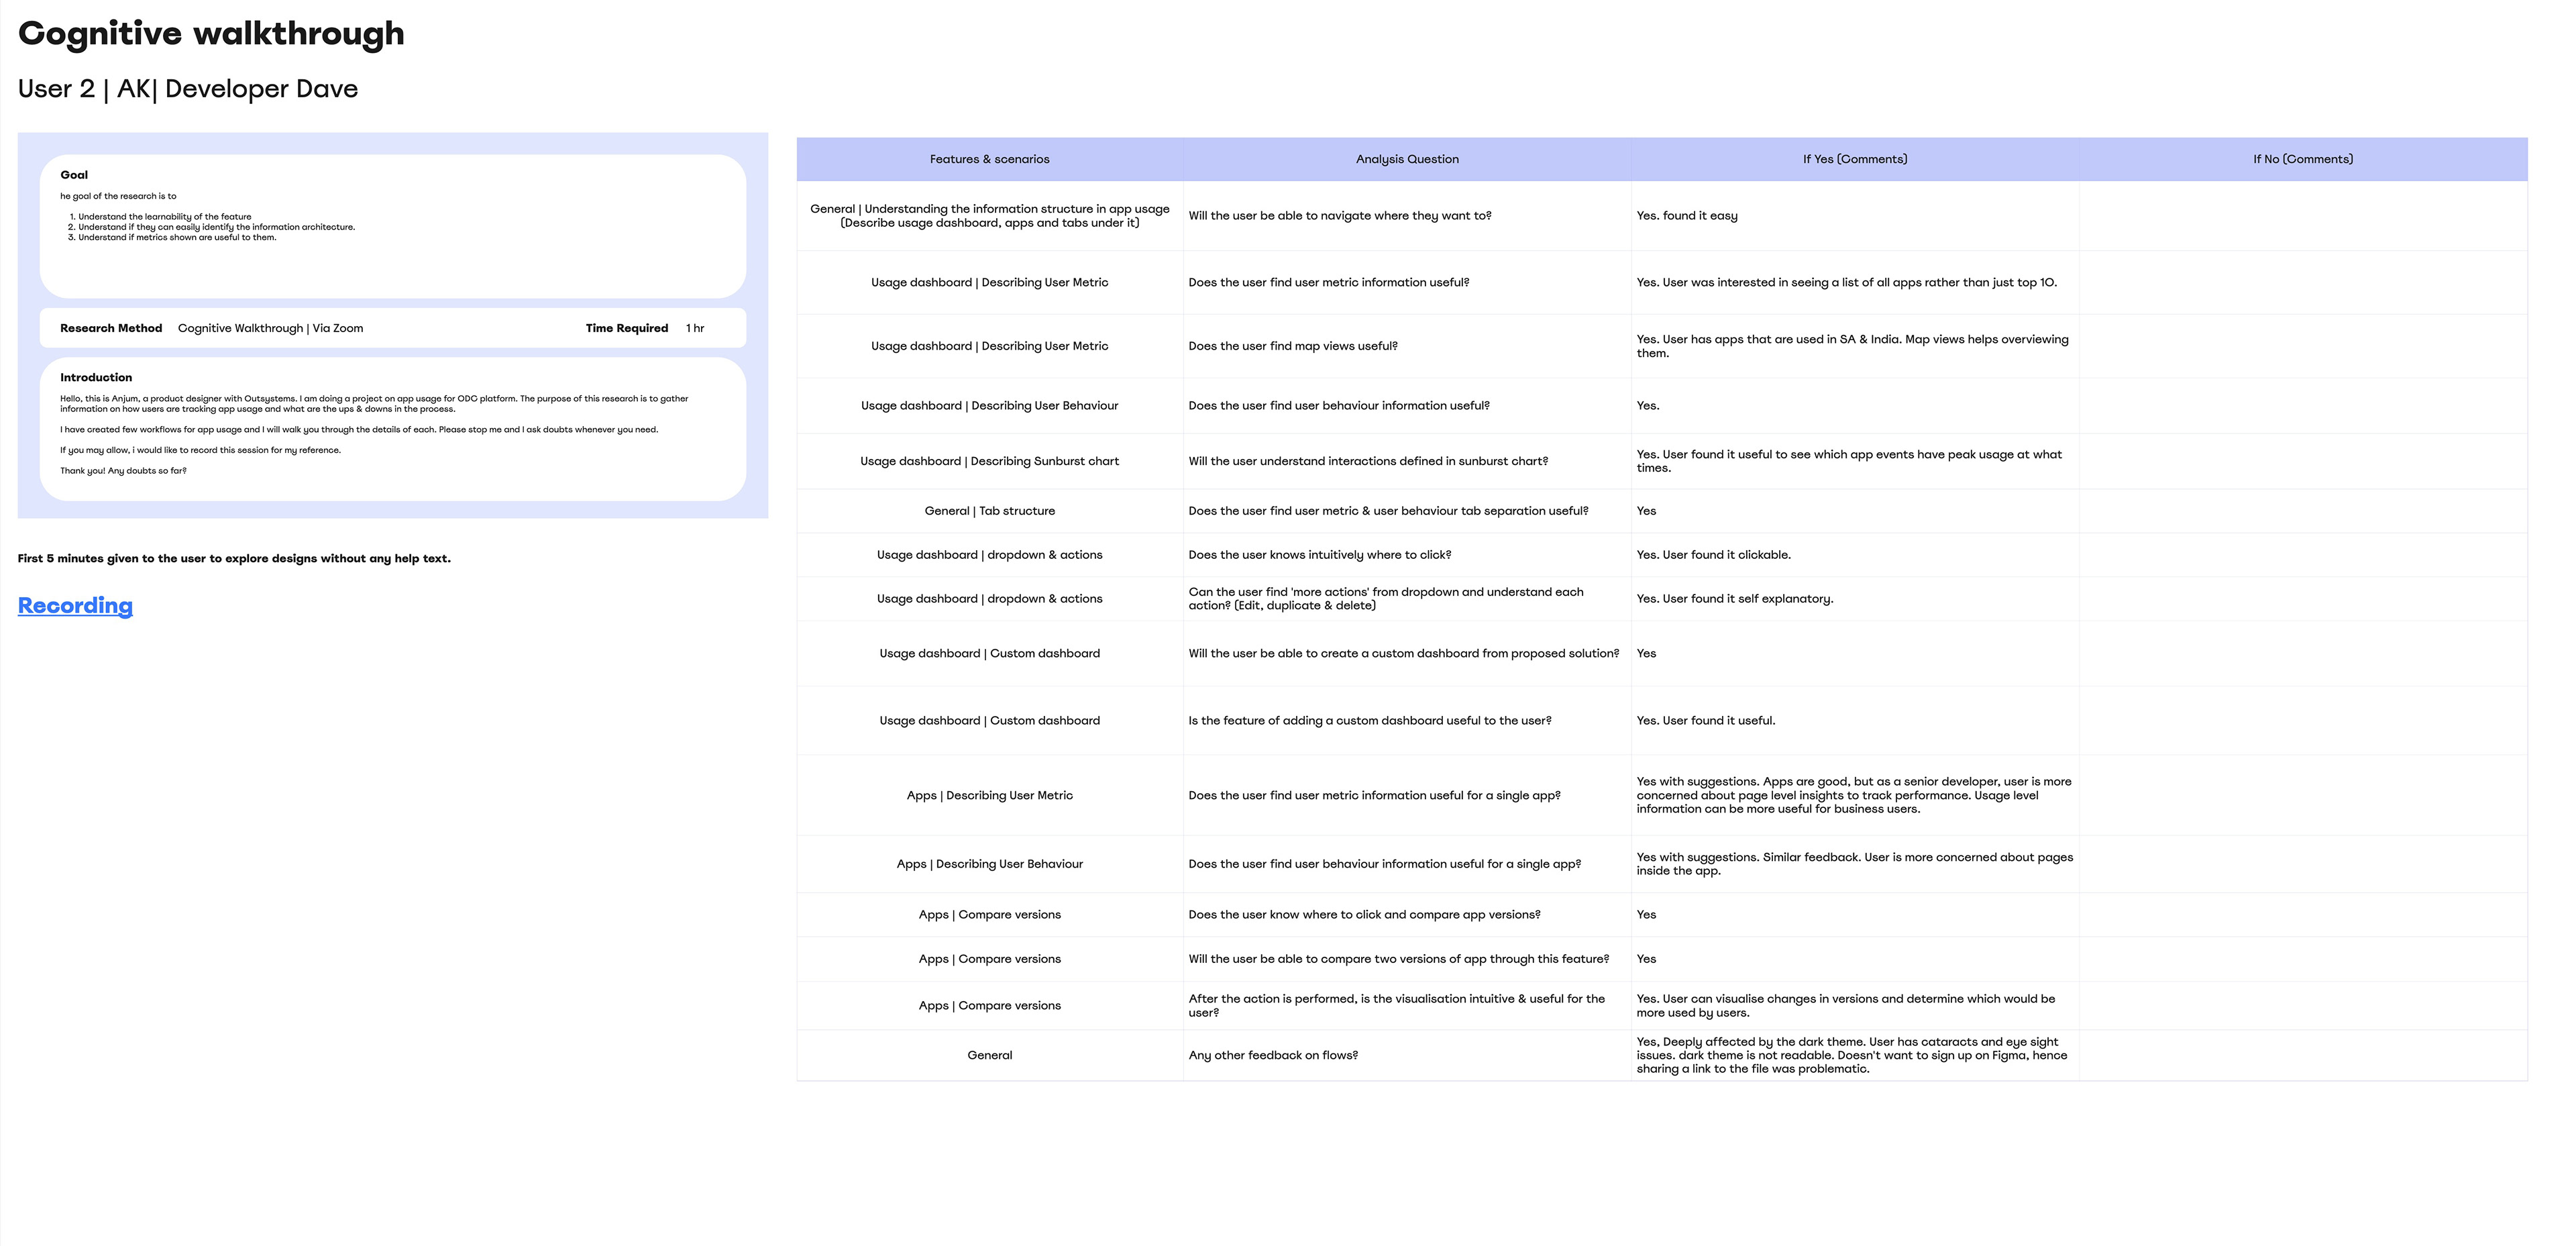
Solution design | Usability test - Cognitive walkthrough
Post reviews, designs were ready to go into user validation. Usability tests were done to gather the data needed to identify usability issues and improve wireframes wherever needed. Since the designs were of a static UI, a 'Cognitive walkthrough' was arranged with participants. Users interacted with the UI on their own and were able to answer questions regarding functionalities when asked.
Usability tests were also crucial in determining chart types. Example: Sunburst vs Sankey chart
Usability tests were also crucial in determining chart types. Example: Sunburst vs Sankey chart
Solution delivery
The cognitive walkthrough was proven to be effective in determining the direction for digital experience monitoring. I was able to implement necessary improvements and successfully deliver a development-ready product within the designated timeframe.
Impact & future steps
Digital experience monitoring encompasses a broad range of features. The solution designed can be termed as V1.
The impact of solution was measured through following metrics:
• The solution was tested with 6 of our enterprise clients in beta phase for a span of 45 days
• 95% of users were able to successfully adopt to DEM with their existing applications within a week
• 90% users found the usage metrics shown on dashboard relevant to their applications
• All users agreed that the user & behaviour metrics helped them understand their real users better
• Clients were able to improve the user experience (technical & behavioural) of an app in real time
• 5 out of 6 clients showcased interest in migrating from their existing 3rd party APM tool to Outsystems ODC for DEM
Note: The design is currently in development phase, more updates will be added here once it gets a global release.